How to Measure Brand Equity: A Practical Framework for Marketers (2026)

Over 85% of B2B decision-makers are inclined to shortlist vendors they recognize and trust. Let that sink in for a second. Not features. Not specs. Not even price. Just the name on the box.
That number tells you everything about why brand equity matters—and also why it’s so frustrating to work with. Because measuring brand equity means quantifying a feeling. A vibe. Something that lives in consumers’ minds and stubbornly refuses to show up on a spreadsheet.
I’ve seen teams spend six figures on brand studies that told them what they already suspected. And I’ve seen others ignore brand equity entirely, then act surprised when a competitor with a worse product starts stealing market share.
The truth: measuring brand equity is possible, but most people overcomplicate it or use the wrong tools. This guide covers the brand equity metrics worth tracking, the frameworks that hold up, and how modern social media listening has changed the whole game.
What is brand equity?
At its core, brand equity is the perceived value your brand carries in the minds of the people who buy from you—or choose not to. It’s the reason someone grabs a Coca-Cola instead of the store-brand cola sitting right next to it for half the price. The same product, broadly speaking. Totally different brand experience.
Worth clarifying something that trips people up: brand equity is not brand value. Brand equity is perception—what your customers think and feel. Brand value is a dollar figure, what a buyer would pay to acquire your brand outright. One feeds the other, but they’re measured differently. A solid brand analysis helps you separate the two.
Most of the academic literature breaks brand equity into four pillars: brand awareness, brand associations, perceived quality, and brand loyalty. That framing comes from Kevin Lane Keller’s foundational 1993 research, where he defined customer-based brand equity as what happens when someone reacts more favorably to a branded product than to the exact same product without the label.
Apple, Nike, Coca-Cola—they’ve all spent decades building that gap between the branded and unbranded versions. That gap is brand equity, and it’s worth more than most tangible assets on a balance sheet.
Why measuring brand equity matters
Here’s where I get a little opinionated: measuring brand equity matters more than most people think, and the teams that skip it usually regret it. Here’s why.
Strong brand equity means you can charge a price premium. Full stop. Research shows that 13% of consumers will pay up to 50% more for products from brands they believe make a positive impact. That’s revenue generated from perception alone. If you can’t measure whether your target market sees you as the premium option, you’re pricing blind.
It also shows up in customer loyalty. Salesforce’s State of the Connected Customer report found that 88% of customers say good service makes them more likely to buy again. Loyal customers cost less, spend more, and forgive more. Tracking brand loyalty and customer retention rate tells you whether you’re building something durable or just renting attention.
And then there’s competitive positioning. You genuinely cannot improve your market position without knowing where you stand. A structured competitor analysis based on social data will show you exactly where your brand compares well and where it’s getting outflanked. Without that? You’re just guessing.

The marketing ROI argument is straightforward. Brand equity tracking tells you if your marketing strategies are actually shifting awareness, brand perception, and customer sentiment—or just generating activity reports nobody reads.
Two more reasons, briefly. Crisis resilience: brands with positive equity bounce back faster because customers extend the benefit of the doubt. Brand reputation monitoring lets you watch this in real time. And stakeholder confidence: quantified brand performance data beats “our brand feels strong” in every boardroom conversation, every time.
Key brand equity metrics to track
Alright, let’s get into it. These are the key indicators that, when tracked together, give you an honest read on your
brand’s health. No single metric tells the whole story. But the combination? That’s where things get interesting.
Brand awareness (aided and unaided)
Unaided awareness is the big one: can someone name your brand unprompted when asked about your category? “Name a running shoe brand”—if you come up, you’re in good shape. Aided awareness is softer—they recognize you from a list. Both feed into your brand equity picture, but unaided recall is the real test of where you sit in your target market’s mental hierarchy.
To measure brand awareness, you’ve got surveys, website search volumes, direct traffic trends, and social media mentions. A tip I’ve found useful: if your search volumes are climbing while your ad spend stays flat, something organic is happening. That’s brand power building quietly. If the numbers are going in the wrong direction, a focused brand awareness campaign might be overdue.
Brand associations and brand image
When someone hears your name, what pops into their head? Speed? Trust? “Oh, that company that had the weird Super Bowl ad”? Brand associations shape purchasing decisions in ways people rarely articulate. Two brands selling the same product at the same price will get wildly different results depending on what’s rattling around in consumers’ minds.

This one is inherently qualitative. Focus groups help, but they’re expensive and slow. What’s changed things is
brand sentiment analysis. You can now surface the dominant themes in how people talk about your brand across thousands of conversations. Pair that with social media intelligence that captures image and video context, and you get a much richer view of how your brand image lives out in the wild. Way more honest than a focus group, too.
Perceived quality
Here’s the thing about perceived quality: it doesn’t have to match actual quality. In brand equity terms, perception wins every time. CSAT scores, online review trends, product rating trajectories—all useful. But what really matters is the direction. Are people’s opinions of your quality going up or down over time?
Real story: a consumer insights team I worked with noticed their Amazon ratings slipping despite zero changes in manufacturing. Took them weeks to figure out that a competitor had started running aggressive comparison ads. The product hadn’t changed. Customer perceptions had. Ongoing social media research would have flagged that shift way sooner. Sometimes, the most expensive insights are the ones you get too late.
Brand loyalty and customer retention
Repeat purchases, high customer retention rates, loyalty program enrollment—the usual suspects. But my favorite loyalty indicator is something harder to quantify: willingness to wait. Research shows that 25% of consumers will pay 25% more for their favorite brands. Think about that. A quarter of loyal customers will sit on their hands rather than give money to someone else. That’s strong brand loyalty doing real work.
Track this through CRM data and repeat business rates. And don’t sleep on brand advocacy—advocates don’t just buy, they recruit. If you’re curious about the mechanics, understanding how social media listening can increase customer advocacy is one of the fastest paths to turning customers into a growth engine.
Net Promoter Score (NPS)
NPS gets a lot of hype, and honestly, it deserves about half of it. The concept is dead simple: how likely are you to recommend this brand? That’s it.
According to Bain & Company, above 50 is excellent, and above 70 is world-class. But NPS alone tells you very little. It’s a temperature check, not a diagnosis. Pair it with how social media engagement trends track alongside your NPS, and now you’re getting somewhere useful.

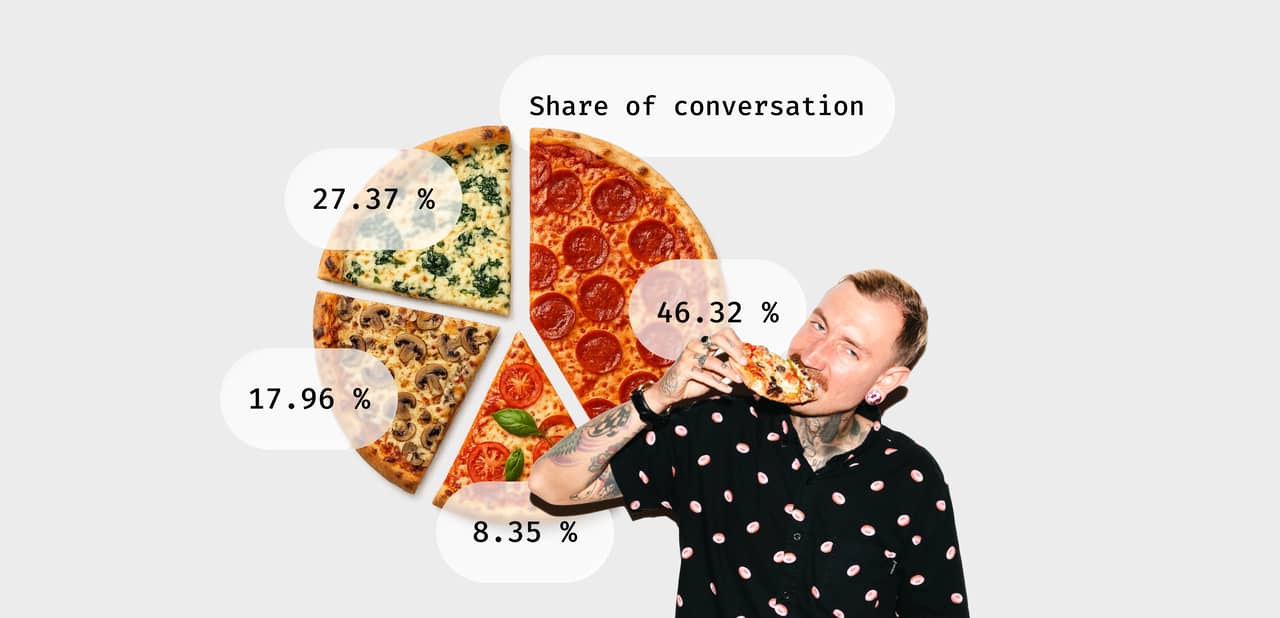
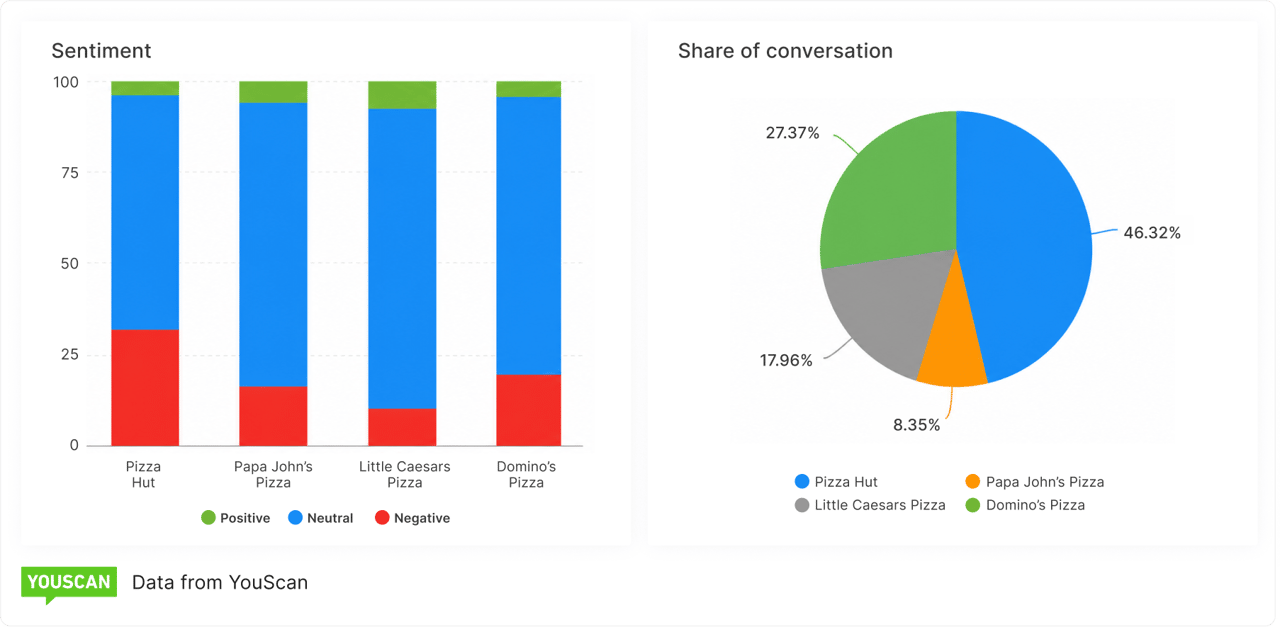
Brand sentiment and share of voice
This is the metric category I think most teams underweight. How people feel about your brand across online conversations—and how much of the overall conversation you own versus competitors—these are arguably your most actionable brand tracking signals. Social listening tools can surface shifts in brand perception before they ever show up in sales data. By the time revenue dips, sentiment has usually been sliding for weeks.


Share of voice shows whether your brand is gaining or losing mindshare relative to competitors. Social media sentiment analysis tells you the emotional texture of that attention. Are people talking about you because they love you, or because something went wrong? The difference between those two scenarios is the difference between positive brand equity and a PR fire. That’s consumer insights doing what no quarterly report can.
Financial brand equity indicators
Some brand equity metrics live squarely in the finance department: market share, price premium over competitors, revenue attribution, and how total sales respond to price changes. Here’s a quick litmus test: raise your prices by 10%. If demand barely flinches, that’s relative consumer demand telling you your brand has pricing power. If sales crater, well… your brand equity might not be what you thought it was.
Financial metrics are great at telling you what happened. Pairing them with social media analytics tells you why. And the “why” is where the actionable stuff lives.
Brand equity models and frameworks
You don’t need to invent your own framework here. Smarter people have already done the hard work. Pick the one that fits your situation and run with it.
Keller’s customer-based brand equity (CBBE) pyramid
Keller’s model is a pyramid with four levels: salience (do they know you?), performance and imagery (what do they think?), judgments and feelings (how do they react?), and resonance (would they tattoo your logo?). Okay, maybe not that extreme. But brand power builds from the bottom up—you can’t skip to emotional connection without first nailing awareness.
Keller’s own take: the power of a brand resides in what customers have learned, felt, and experienced over time. It lives in their heads, not your marketing deck. If you’re going this route, solid target audience analysis is where you’d start—you need to know whose heads you’re trying to get into.
Aaker’s brand equity model
Aaker’s framework is more commercially minded. Five dimensions: brand loyalty, brand awareness, perceived quality, brand associations, and proprietary assets like patents and trademarks. Where Keller leans emotional, Aaker leans strategic. What tangible assets and competitive metrics make your brand defensible? If you’re product-led, this one might fit better.
Brand Asset Valuator (BAV) and BrandZ
Two more worth knowing about. Young & Rubicam’s BAV looks at differentiation, brand relevance, esteem, and knowledge. Kantar’s BrandZ model ties consumer perception to financial outcomes. Both are more useful at the enterprise level for global brand tracking and benchmarking, but they add depth that the other two models don’t fully cover.
Quick comparison:
Model | Focus | Best for | Key dimensions |
Keller CBBE | Consumer perception & emotion | B2C, emotional brands | Salience, meaning, response, resonance |
Aaker | Strategic brand assets | Product-driven brands | Loyalty, awareness, quality, associations, assets |
BAV | Brand health over time | Large-scale benchmarking | Differentiation, relevance, esteem, and knowledge |
BrandZ | Financial + perception linkage | Enterprise brand valuation | Meaningful, different, salient |
How social listening changes brand equity tracking
This is the section where I have the strongest opinions, so bear with me.
Where traditional methods fall short
Annual brand trackers worked fine in 2005. They’re showing their age now. Surveys are slow, expensive, backwards-looking, and riddled with response bias. By the time your annual brand equity report lands on someone’s desk, the market has already moved.
You’re staring at a Polaroid when you need a live feed. If you’re not clear on the difference between social listening vs social monitoring, that’s a good place to start understanding what modern approaches offer.
Real-time brand equity tracking with social listening
AI-powered social listening flips the model entirely. Instead of asking people what they think in a controlled setting, you’re watching what they actually say when no one’s paying them to answer. Unprompted. Unfiltered. In real time.
Platforms like YouScan give you continuous access to customer sentiment, brand mentions, competitive benchmarks, and consumer trends—across social media, forums, review sites, and blogs. It doesn’t replace surveys. But it fills the enormous blind spots between them, and the real-time data is often more useful anyway.
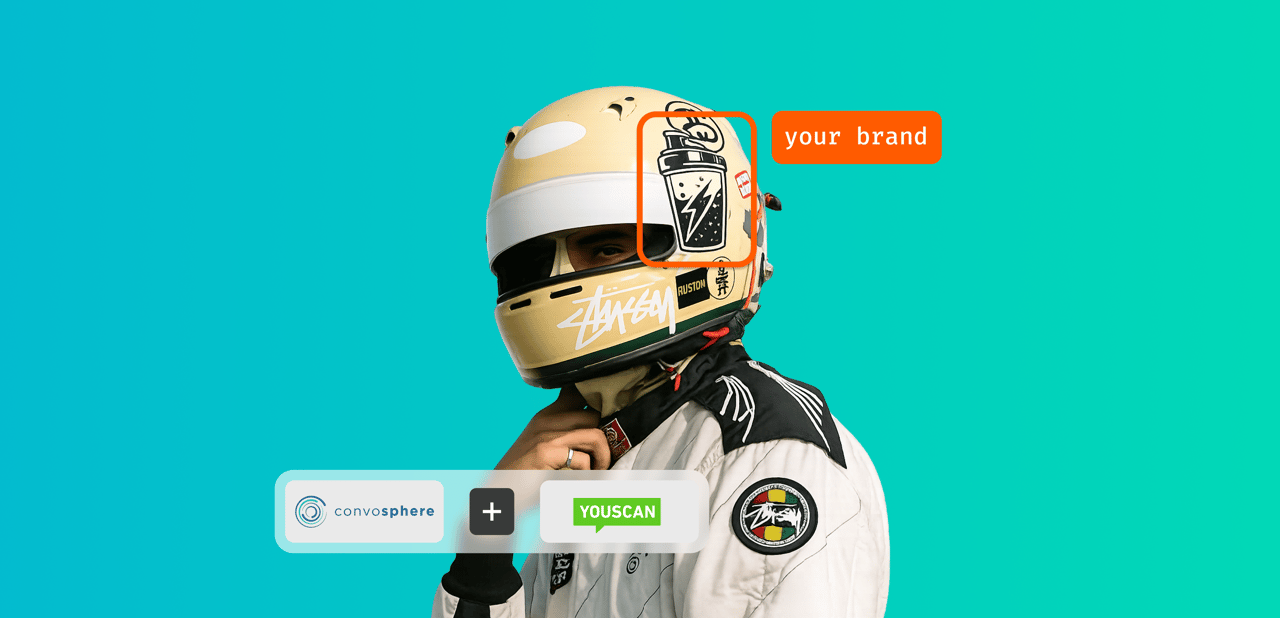
Visual insights and logo recognition
Here’s the part most brand measurement approaches completely miss. People talk about your brand in images. All the time.
Someone posts your product on Instagram without tagging you. Your logo appears in a YouTube unboxing. Traditional social media monitoring tools see none of that.
YouScan’s Visual Insights picks up brand appearances in user-generated images using AI-powered logo recognition—capturing up to 80% more brand mentions than text-only tools. That’s an entire layer of brand presence data that most teams are just… leaving on the table.
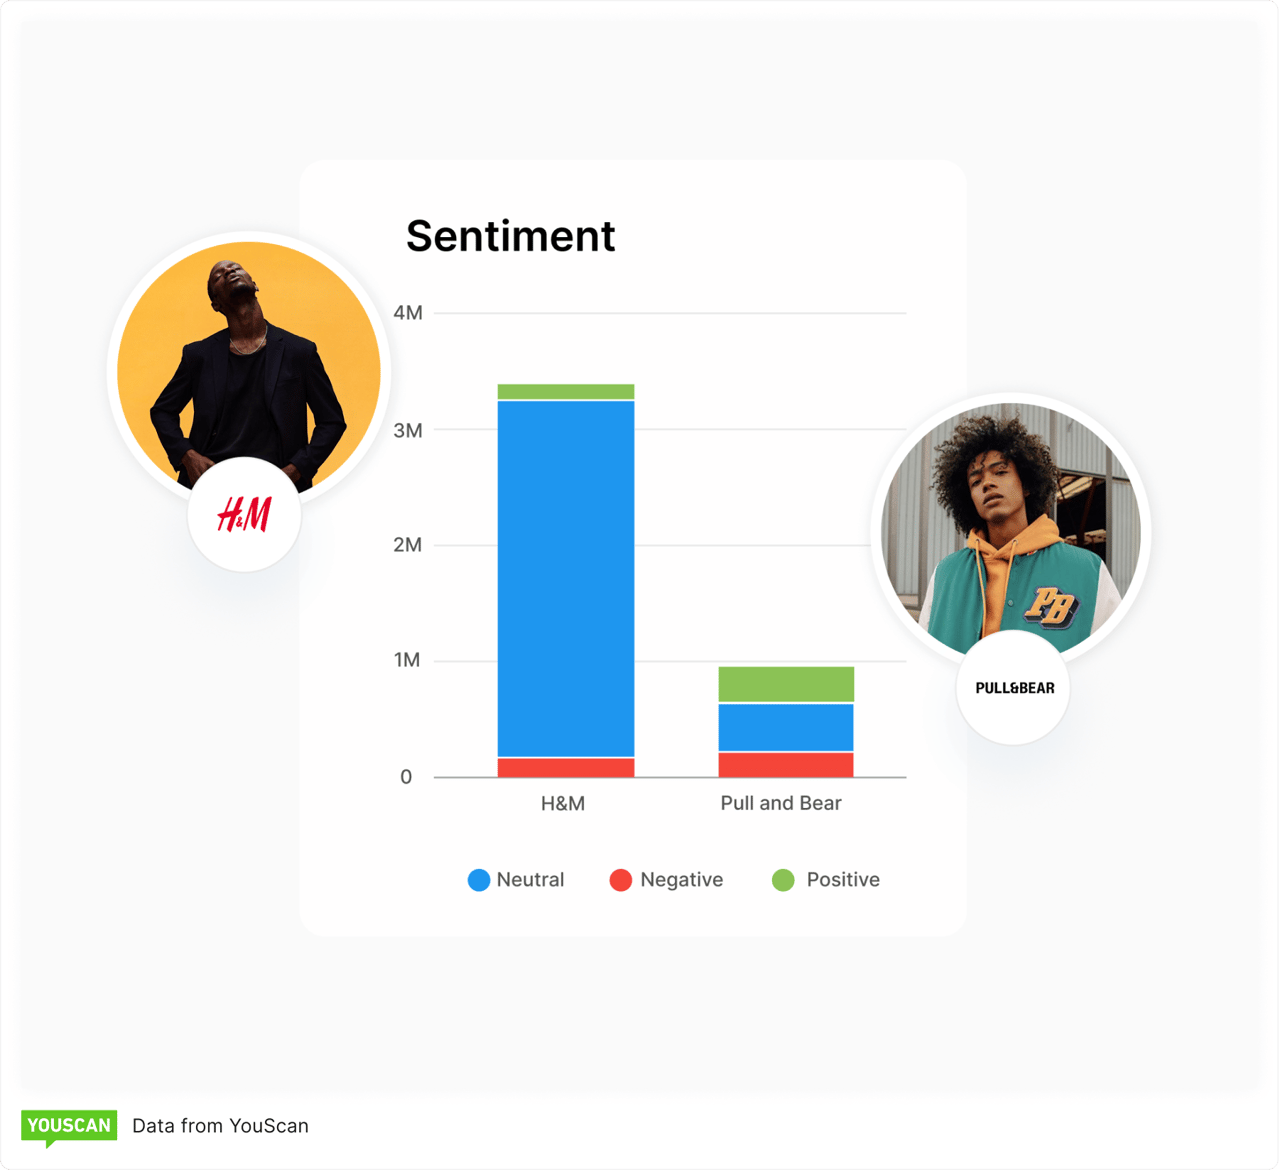
AI-powered sentiment analysis at scale
Modern AI does more than count positive versus negative mentions. It gets context. Sarcasm. Emoji. Threads where the tone shifts halfway through. The best sentiment analysis tools are genuinely impressive at this now. YouScan’s Insights Copilot lets you ask questions in plain language—“Why did sentiment drop in the Southeast last week?”—and get a real answer, not a dashboard you have to decode. Pair that with audience insights that tell you who’s talking, and you’ve built something that actually functions as a continuous brand perception tracking system. Not a report. A system.
How to measure brand equity step by step
Okay, practical mode. If you want to go from “we think our brand is strong” to actually having the data to back that up, here’s how:
1. Get specific about what you’re measuring. Customer loyalty? Brand awareness? Competitive position? Brand relevance in a new market? Vague goals produce vague results. Pick your KPIs before you pick your tools.
2. Establish baselines. You need a starting point. Pull together what you already know from surveys, web analytics, CRM data, and social listening. Without a baseline, everything is just a number floating in space.
3. Pick a framework that fits. Keller for emotion-driven B2C. Aaker for product-led strategies. Don’t overthink this—just pick the model that matches your brand positioning and start using it.
4. Combine old and new tools. Surveys and focus groups still have a role. But pairing them with AI social listening gives you the continuous, real-time layer that traditional research can’t. Use both. Seriously.
5. Track over time. Brand equity is a trend line, not a snapshot. Set up dashboards, automate reporting, and use a
trend analysis tool to catch shifts early. Monthly or quarterly reviews are the minimum.
6. Benchmark against competitors. Brand equity is relative. Your brand might be growing, but if your competitor is growing faster, your market position is shrinking. Stay honest.
7. Do something with the data. Measurement without action is just expensive curiosity. Route your findings into marketing strategies, product decisions, and brand experience improvements. Otherwise, what’s the point?
Best practices for brand equity measurement
Blend the quantitative and qualitative. Sales data tells you what happened. Social listening tells you why. Neither gives you the full customer experience picture on its own—you need both, and most teams lean too hard on one or the other.
Track continuously. Please. Real-time brand monitoring catches problems when they’re still small. Annual studies are a starting point. They’re not a strategy.
Segment everything. Brand equity looks different across demographics, geographies, and product lines. What resonates with one audience might completely miss with another. Don’t average your way to a false conclusion.
And tie it to outcomes. This matters more than most people realize. Connect brand metrics to revenue, customer retention, repeat purchases, and long-term growth. If you can’t draw a line from brand perception to business results, the C-suite will nod politely and then fund something else.
Start tracking brand equity the right way
Brand equity isn’t a mystery. It’s measurable—when you pair the right metrics with a good framework and tools that give you ongoing visibility into what customers actually think. The biggest shift happening right now is from annual surveys to continuous, AI-powered measurement. The brands that make that shift see problems sooner, act faster, and build stronger over time.
If you want to add a real-time layer to your brand equity tracking, try YouScan’s platform and see what continuous monitoring of brand sentiment, competitive benchmarks, and visual mentions looks like in practice.
FAQs
What is brand equity, and why does it matter?
Brand equity is the value customers assign to a brand based on their perceptions of its quality, reliability, and reputation. Greater brand equity translates to pricing power, customer loyalty, stronger market share, and a positive reputation that supports sustainable growth. It’s the reason customers choose one brand over the same product from a competitor.
What are the key metrics for measuring brand equity?
The core brand equity metrics include: brand awareness (aided and unaided recall), perceived quality (customer ratings and satisfaction), brand loyalty (repeat purchases, retention), net promoter score (likelihood to recommend), brand sentiment (positive vs. negative online conversations), market share, and price premium over competitors.
How is brand equity different from brand value?
Brand equity reflects customer perceptions—how people think and feel about a brand. Brand value is a financial figure—how much the brand is worth in monetary terms. Equity drives value: the stronger customers feel about your brand, the higher its financial worth. But they’re measured with different methods.
What is Keller’s brand equity model?
Keller’s Customer-Based Brand Equity (CBBE) model is a pyramid framework with four levels: salience (brand identity and awareness), meaning (brand performance and imagery), response (customer judgments and feelings), and resonance (deep brand loyalty and community). The model shows that building a strong brand requires moving sequentially from basic recognition to deep emotional connection with your audience.