How to Measure Social Media Engagement That Actually Predicts Revenue
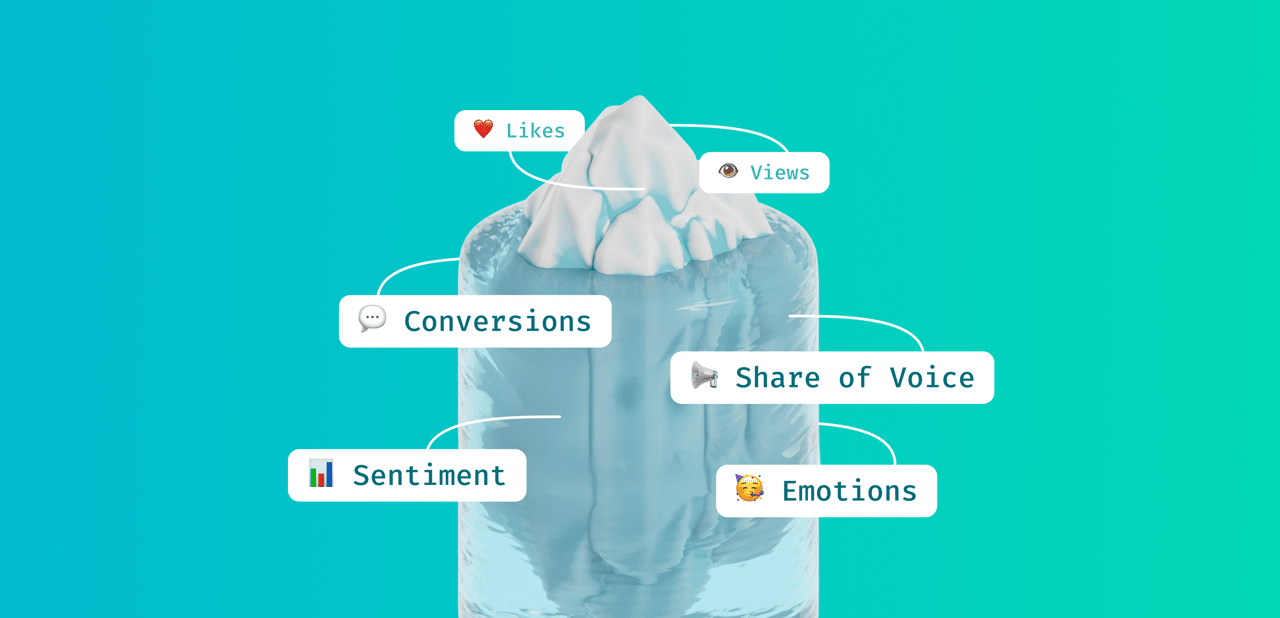

Here's what we've learned after years of helping brands make sense of their social media performance: measuring social media engagement isn't the same as counting interactions. Anyone can count likes. The brands that actually grow dig into the quality, sentiment, and business impact behind every comment, share, and click across their social media platforms.
This guide covers how to measure social media engagement properly. Which engagement metrics matter, how to calculate engagement rate without fooling yourself, and how to turn the numbers into decisions that improve your social media success.
What is social media engagement?
Social media engagement measures how actively your target audience interacts with your content across social media platforms and social channels. That means likes, comments, shares, saves, clicks, direct messages, and brand mentions, plus user-generated content that features your brand on each social network. Put simply, social media engagement metrics quantify attention that people choose to give you.
Why care? Because engagement, when measured correctly, connects to business outcomes. Higher engagement typically brings more brand awareness, stronger customer loyalty, more website traffic, better conversion rates, improved customer satisfaction, and greater brand visibility. Not bad for a metric people still dismiss as fluffy.
Why measuring social media engagement matters for your marketing strategy
If your marketing strategy treats social media as a box to tick, you'll measure the wrong things. Measurement is what separates social media efforts that earn budget from social media efforts that get cut.
Vanity metrics vs. engagement metrics that predict results
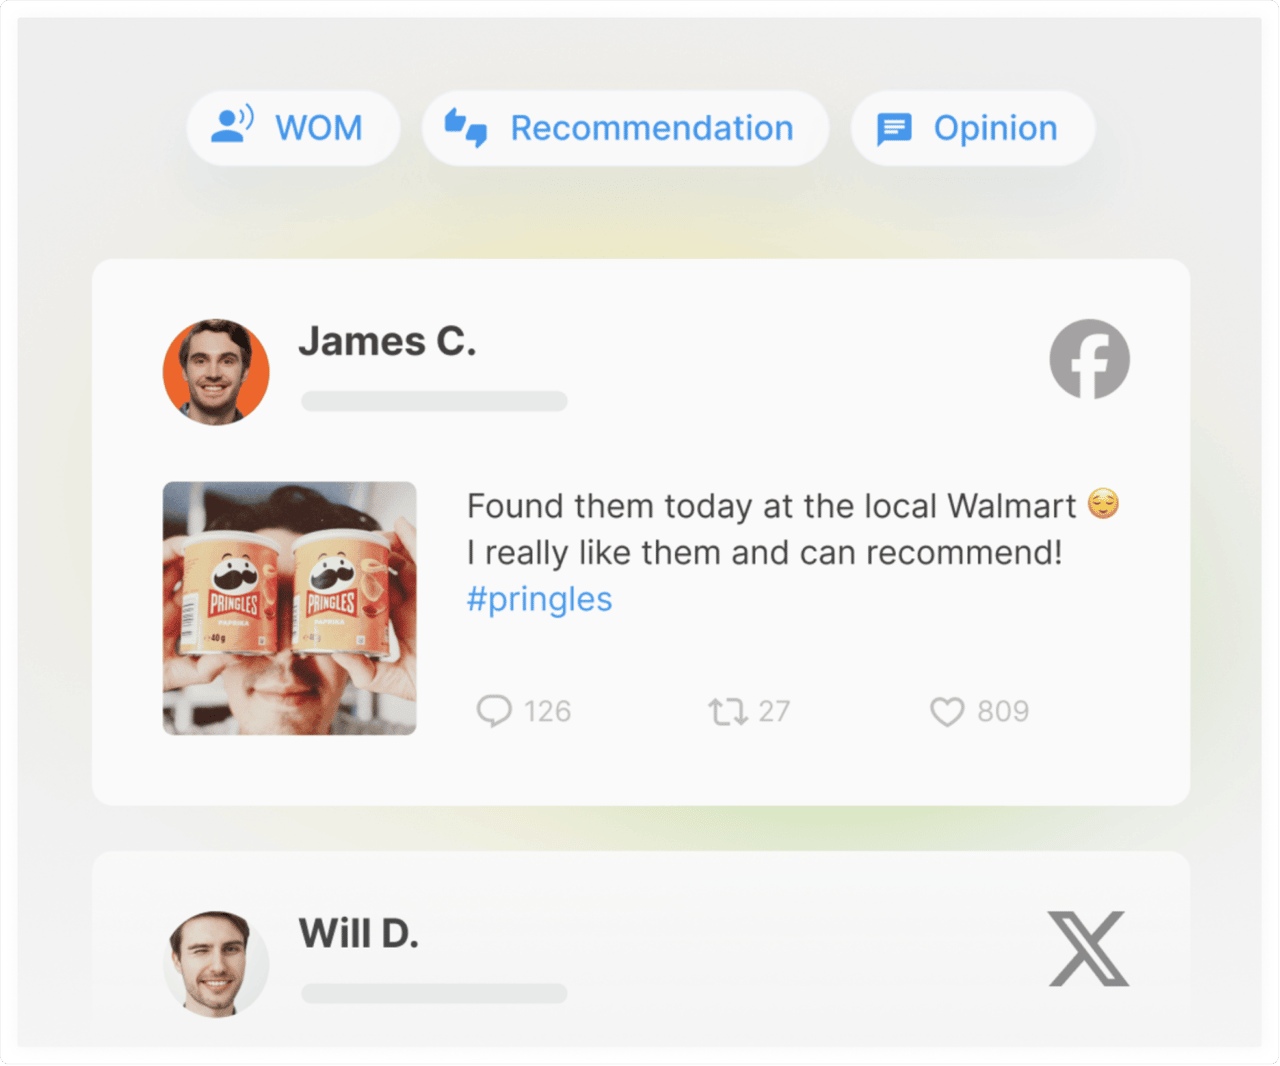
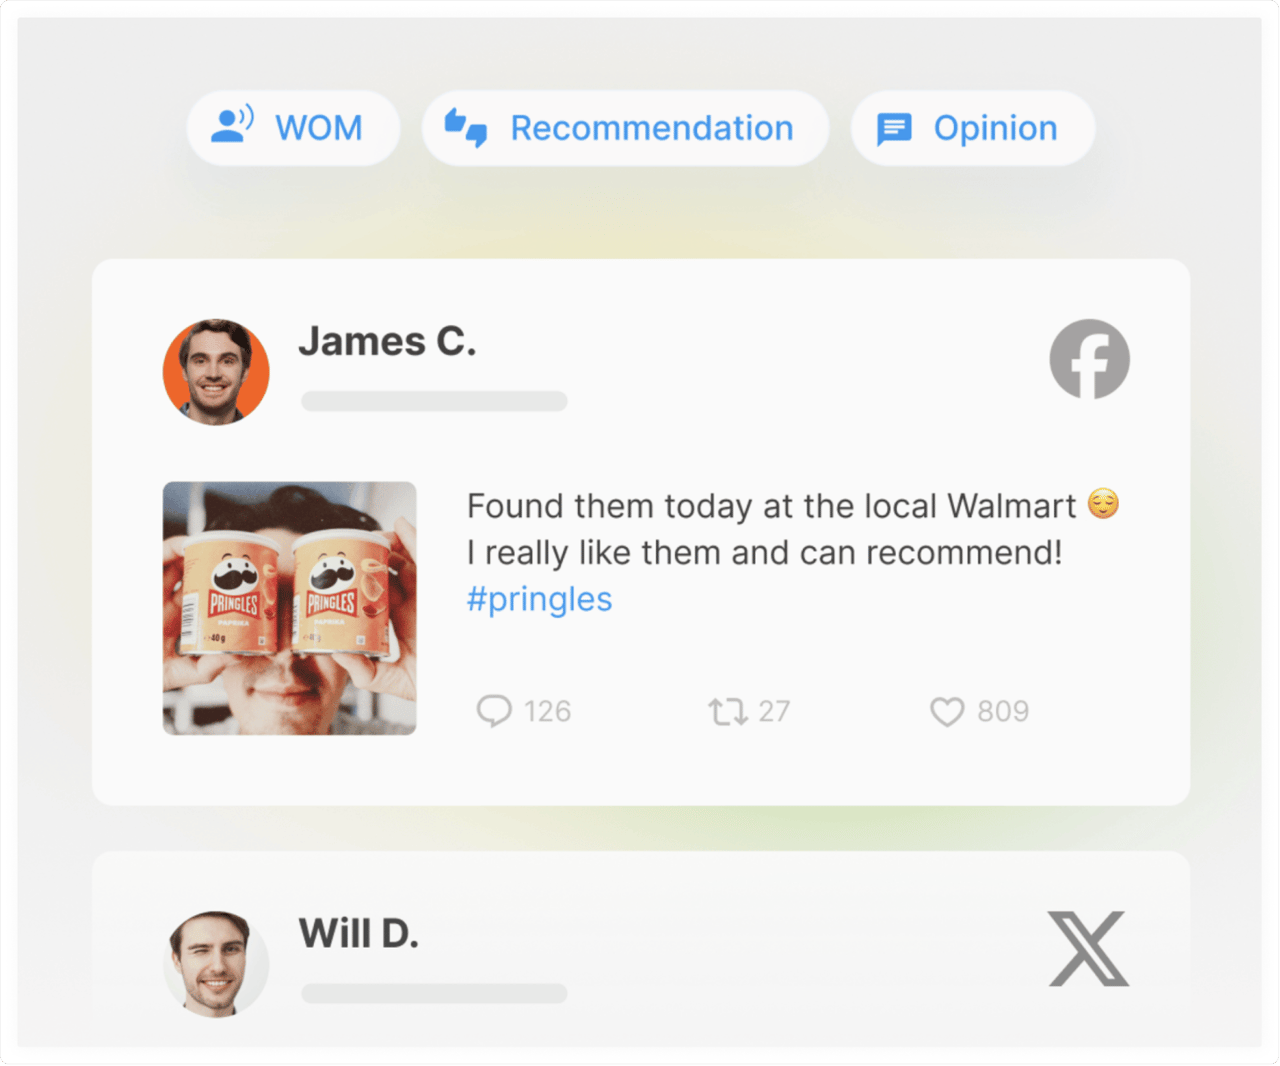
Not all social media engagement metrics deserve your attention. Total likes and follower count feel good. They rarely tell you anything about revenue. Meaningful key metrics track actions that signal genuine interest: comments that start conversations, shares that extend your reach, clicks that send web traffic to your site.
The difference is intent. When someone comments on your social media posts or shares them with their network, they're investing effort beyond a quick double-tap. That's real customer engagement, and it's worth far more than passive approval. Those are the engagement metrics that belong in your social media strategy review.
The questions engagement data answers for marketing leaders
Strong social media analytics let marketing leaders answer the questions that come up in boardrooms:
"Are we resonating with our target audience?"* Check engagement rates segmented by audience demographics, then compare those audience demographics against the customers who actually buy.
"What content works?"* Break down performance data by topic, format, and message to see which social media posts drive positive engagement.
"How do we compare with competitors?"* Track share of voice and relative engagement rates in your industry to measure success against the market, not just against last month.
The social media metrics that actually measure engagement
Here are the essential metrics worth tracking if you want a comprehensive understanding of your social media performance, and the data-driven decisions they support. Treat these as your core performance metrics; everything else is garnish.
Interactions: likes, comments, shares, saves, and clicks
Each interaction signals a different intensity of customer engagement. Likes are basic approval. Cheap, but still a pulse.
Shares usually matter most because they push your content to new audiences across social channels. A share is an endorsement. Saves tell you your content has lasting value, since people bookmark what they plan to return to. And comments? They're where actual conversations happen, which is why so many engagement strategies obsess over them.
Reach, impressions, and follower growth rate
Reach counts unique users who saw your content. Impressions count total views, repeats included. The distinction matters when you calculate the rate, because the denominator changes the story.
Follower growth measures whether your audience is expanding at all. Track your audience growth rate with a simple formula: (new followers ÷ total followers) × 100. But watch quality, not just quantity. A spike of new followers who never engage does nothing for your social media accounts. Compare the audience growth rate across your social media accounts, too, since it shows which channels are actually compounding. If Instagram is your priority channel, there are proven ways to boost Instagram followers without buying junk audiences.
Click-through rate, web traffic, and conversion metrics
Click-through rate ties your social media efforts to your website: (clicks ÷ impressions) × 100. It's the bridge between engagement and revenue, and the clearest link between social media performance and website traffic.
Add UTM parameters to links in your posts and ad campaigns so Google Analytics can attribute campaign traffic correctly. That's how you learn which social media platforms and social media campaigns send visits that convert, and where your social media advertising budget earns its keep.
Then look at conversion metrics. Track the direct conversion rate from social media traffic, but don't ignore assisted conversions. Social media often plays a research role early in the buying journey, so a low last-click conversion rate can hide real influence. Compare the conversion rate of social visitors against your site average before judging; even a small conversion rate lift from smarter targeting usually pays for the whole measurement effort.
Sentiment, share of voice, and customer satisfaction
Modern measurement goes beyond counts. Social media sentiment analysis reveals whether engagement is positive, neutral, or negative. A post with high engagement and angry comments is not a win, whatever the dashboard says.
Share of voice compares your brand mentions against competitors and shows where you stand in the market. Mention quality asks who is engaging: loyal customers and industry voices carry more weight than random accounts. Some teams even fold a customer satisfaction score into their reporting to connect social conversations with support outcomes. If any of these terms are new, YouScan's social listening glossary covers them all in plain language.
How to calculate engagement rate (the simple formulas)
The social media engagement rate formula that every other calculation builds on:
Engagement rate = (Total engagement ÷ Reach or Impressions) × 100For total engagement, add likes, comments, shares, saves, and clicks for a post or a reporting period. Pick reach or impressions as your denominator and stick with it, or your comparisons become meaningless.
Quick example. An Instagram post gets 150 likes, 23 comments, 12 shares, and 8 saves, with 5,000 impressions. Total engagement: 193. Engagement rate: (193 ÷ 5,000) × 100 = 3.86%. Strong result. You can also run the calculation by followers, which helps when impressions data isn't available, though it punishes accounts with large, older audiences.
Engagement rate benchmarks: what "good" looks like in 2026
Benchmarks shift every year, so anchor to fresh data. According to Socialinsider's 2026 benchmark study of 70 million posts, average engagement rates by followers across the big social media platforms currently sit around:
TikTok: 2.70%
Instagram: 0.45%
Facebook: 0.13%
X (Twitter): 0.10%
Context beats comparison, though. Benchmarks help you measure success only in relative terms. A B2B brand tracking LinkedIn Analytics might see modest rates but high-value conversions. Focus your social strategy on beating your own baseline, and read up on the latest trends in marketing metrics before you panic over a benchmark that was never built for your industry.
How to measure social media engagement in 4 steps
Here's a framework for how to measure social media engagement without drowning in dashboards. Nothing exotic, just sequence and discipline.
Step 1: Tie key metrics to business objectives
Start with your business objectives, then map key social media metrics to each one:
Awareness goals → reach, impressions, share of voice across social channels
Engagement goals → engagement rate, comments, shares, saves
Consideration goals → click-through rate, time on site, saves
Loyalty goals → repeat interactions, advocacy, community brand mentions
Define the questions your measurement should answer. "Are we building brand visibility?" needs different social media metrics than "Are we driving qualified leads?" Measurement should support decisions, not decorate slides. That's the difference between teams that measure social media engagement to learn and teams that do it to look busy.
Step 2: Choose essential metrics and segment your social channels
Pick a short list of essential metrics per goal. The best social media metrics shortlists fit on a sticky note. Tracking so many metrics at once creates analysis paralysis, and it's the fastest way to stop measuring social media success altogether.
Then segment your social media data by platform, content type, campaign, and audience. Performance varies wildly across social media platforms, and aggregate numbers hide the patterns that matter. New followers behave differently from loyal community members. Video behaves differently from carousels. Segmentation is where valuable insights actually come from, and where you'll find what could boost engagement next quarter.
Step 3: Collect performance data from Meta Business Suite, Google Analytics, and listening tools
No single source gives you the full picture, so combine three:
Native, built-in analytics. Meta Business Suite for Facebook and Instagram, LinkedIn Analytics, TikTok Analytics. Free, official, and detailed performance data for your owned content. These built-in analytics are the ground truth for owned social media performance.
Social media management tools. A social media management platform centralizes publishing and cross-channel reporting, which saves hours if you run several social media accounts across different social networks. Most social media management suites, however, still focus on owned content.
Social listening. AI social listening platforms like YouScan capture brand mentions you're not tagged in, measure social media sentiment at scale, and pull everything into social listening dashboards your whole team can read. YouScan keeps adding sources too, including Moltbook monitoring for brands whose audiences are active there. And Google Analytics closes the loop by showing what social media traffic does after the click. Together, the three sources give you a comprehensive understanding of owned and earned engagement.
Step 4: Benchmark, report, and adjust
Look for patterns over time instead of judging individual posts. Month-over-month trends show whether your social strategy is moving in the right direction; a single viral post shows nothing. Watch how your audience growth rate moves alongside engagement, because the valuable insights live in the trendlines, not the totals. Your analytics tools should make that comparison easy.
Report against benchmarks and competitors, and treat the report as a brand health tracker rather than a scoreboard. Weekly snapshots keep social media campaigns on course. Monthly and quarterly reports connect engagement to revenue, retention, and customer satisfaction, which is what executives care about anyway. That's measuring social media success in a way finance will respect.
Measure engagement quality, not just quantity
Two posts with identical engagement rates on the same social networks can have completely different value. Quality analysis is where the interesting valuable insights hide.
Who is engaging, and how do they feel?
A hundred positive comments build brand equity. A hundred complaints signal a problem that may need PR crisis management before it spreads. Sentiment shifts often show up weeks before the quantitative numbers move, which makes them an early warning system.
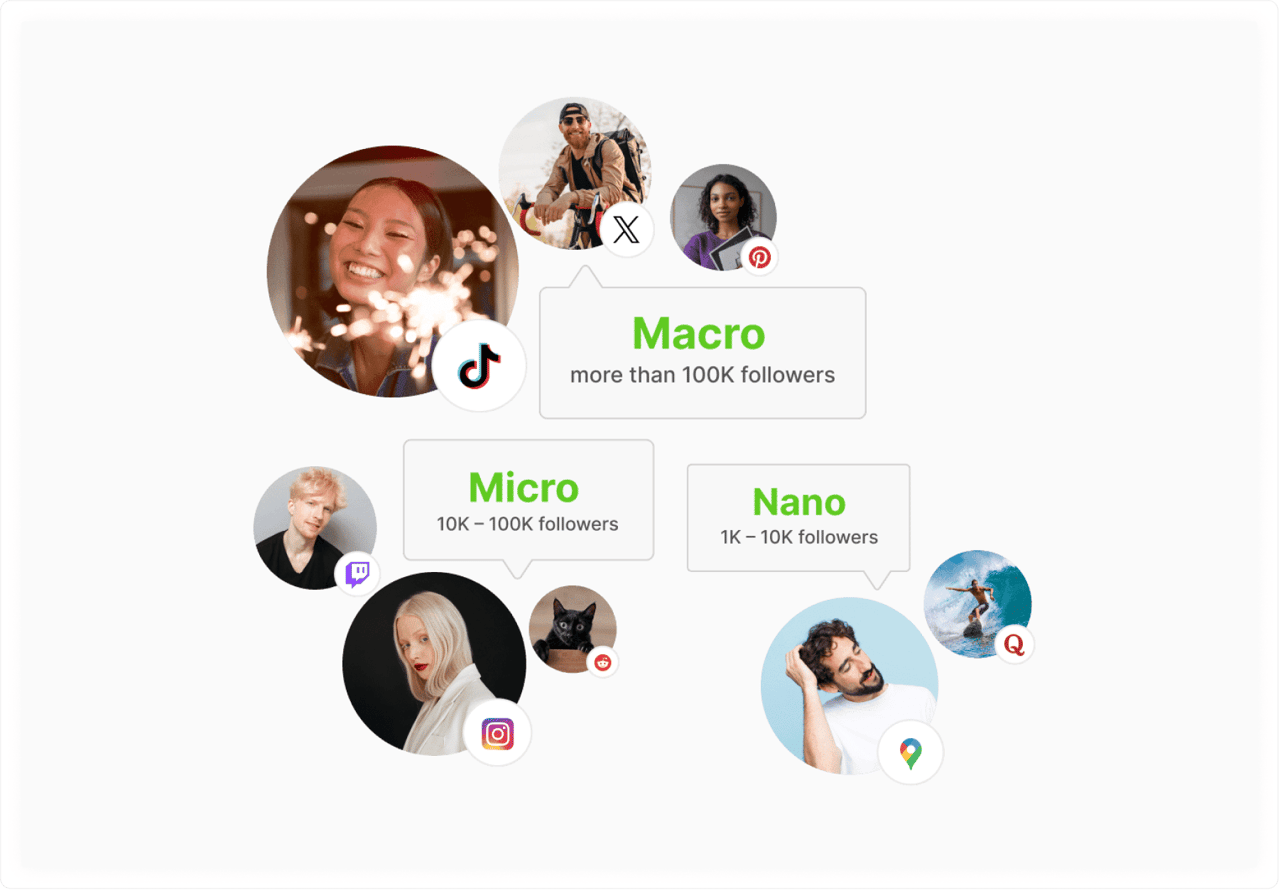
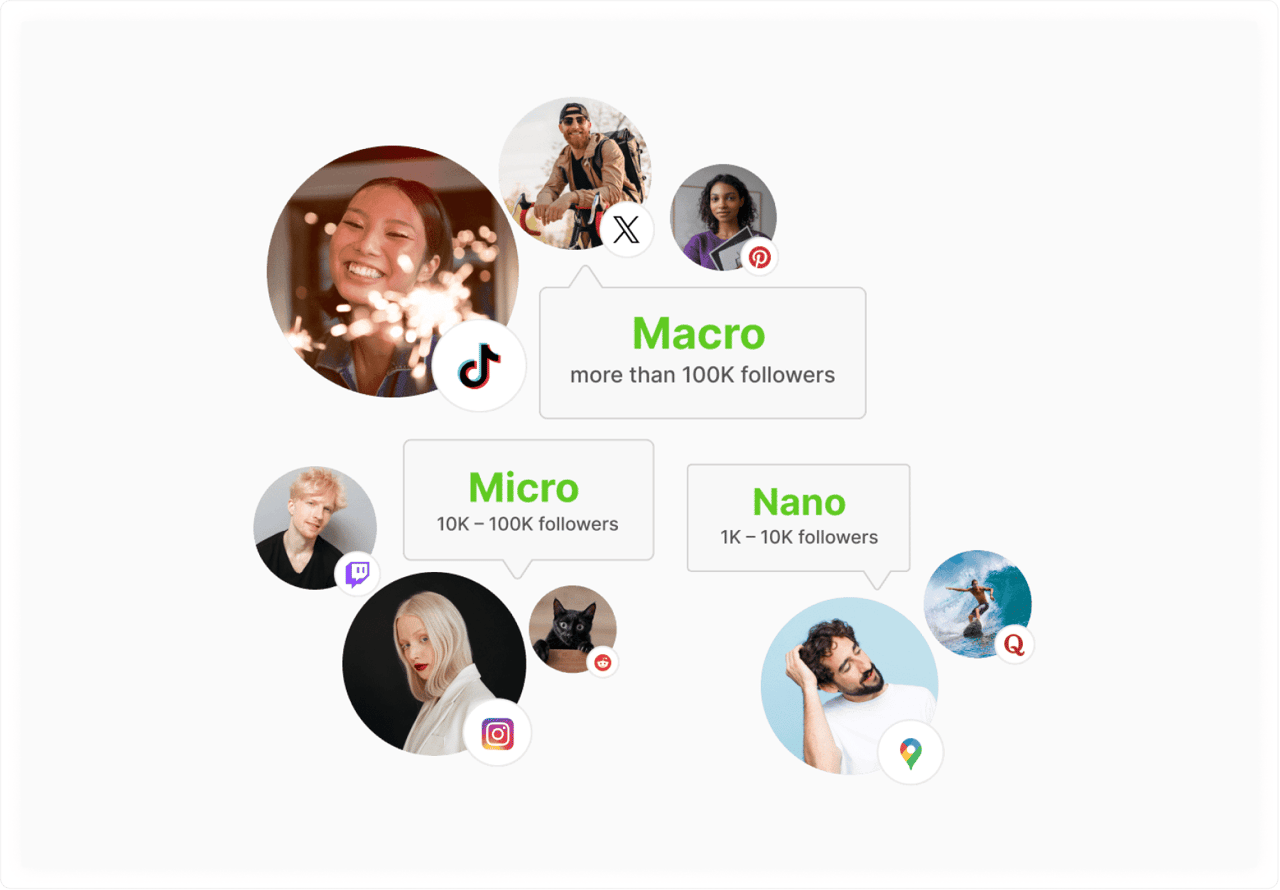
Source matters too. Engagement from micro-influencers and loyal customers beats celebrity drive-bys, because their audiences trust them. The rise of virtual influencers complicates this further; brands now weigh authenticity in ways follower count can't capture. Comments also provide valuable feedback about products and messaging. These qualitative insights, the kind you find in real social listening examples, rarely show up in a metrics dashboard.
Visual and untagged media engagement
Plenty of engagement happens in images and videos where you're never tagged. Image recognition can spot your logos, products, and usage scenes in user-generated content across social media platforms, so you see how customers actually use what you sell, which products generate organic brand mentions, and whether your visual social media presence is growing or shrinking.
Tools and social media analytics that do the heavy lifting
Three tiers of analytics tools, three different jobs.
Most teams end up running native dashboards, a social media management tool, and a listening platform side by side. Native analytics tools are free and accurate for owned content, but blind to the wider conversation. Social media management platforms add cross-channel reporting and workflow on top, and the better social media management tools now bundle basic listening. Social listening tools like YouScan monitor the entire social web: brand and topic listening across major platforms, brand sentiment analysis that goes beyond positive and negative into specific emotions, image recognition, real-time alerts for engagement spikes, and competitive benchmarking.
That combination offers valuable insights you can't get from any single tool, and it reflects where AI in social media measurement is heading: less manual counting, more meaning. The same data can even inform brand partnership marketing decisions, since you can see which potential partners' audiences overlap with yours.
Common mistakes that stall social media success
These traps catch even experienced social media teams:
Tracking so many metrics with no clear goal. More social media data doesn't mean better decisions. Choose key metrics tied to specific choices you need to make.
Worshipping follower count. Follower growth without engagement is an empty room getting bigger. Prioritize valuable metrics that show intent: comments, shares, saves, clicks.
Ignoring sentiment. High engagement with negative sentiment is a fire alarm, not social media success.
Comparing raw numbers instead of rates. A post with 100 likes from 1,000 impressions beat one with 150 likes from 5,000 impressions. Always calculate engagement rate before declaring a winner.
Skipping competitive context. A 2% rate might be excellent in one industry and weak in another. Benchmark or stay guessing.
Avoid these five, and you'll measure social media engagement better than most of your market already does.
Summary: a smarter way to measure social media engagement
Define your goals, choose the right engagement metrics, collect data from both analytics and listening, and analyze for meaning rather than volume. Do that consistently, and your social media strategy stops being a faith-based initiative.
The teams that measure social media engagement best combine owned-content analytics with listening, because that's the only way to capture both what people do with your content and what they say about your brand when you're not in the room. YouScan handles the second part. Book a demo to see it on your own data.
FAQs
What is social media engagement, and why does it matter?
Social media engagement measures how actively your audience interacts with your content through likes, comments, shares, saves, clicks, and brand mentions across social media platforms. It matters because engaged audiences buy more, recommend your brand, and provide valuable feedback that improves your products.
How do you measure social media engagement in a simple way?
Use the formula (Total engagement ÷ Impressions) × 100, track it consistently in your social media analytics, and compare against your own baseline rather than one-off spikes or someone else's numbers.
What social media metrics matter most for engagement?
Focus on engagement rate, comments, shares, saves, click through rate, and social media sentiment. Together, these engagement metrics show interest, resonance, and business impact instead of surface-level approval. Positive engagement from the right people beats big numbers from the wrong ones.
What's a good social media engagement rate?
A good social media engagement rate depends on the platform. In 2026, averages by followers run roughly 2.70% on TikTok, 0.45% on Instagram, and 0.13% on Facebook, so anything above the norm for your platform and industry is solid. Trends in your own engagement matter more than any external benchmark.