From the Ballpark to the Feed: How Insightrix Used Social Listening to Understand the WCBL Season

How Insightrix combined fan research and YouScan social listening to measure brand health, understand what content travels organically, and uncover opportunities for the Western Canadian Baseball League and its teams.
Baseball season is much more than what you live in the stadium, it is also the highlight clips, player stories, comments, reposts, local news coverage, fan reactions, and conversations that continue long after the final out.
That was the challenge facing Insightrix Research, a Canadian market research agency working alongside the Western Canadian Baseball League (WCBL) during its 2026 season.
The WCBL needed to understand two sides of the fan experience: what people attending games thought about their experience at the ballpark, and what the broader audience was saying organically online.
Insightrix approached those questions with two complementary research streams. A post-game fan survey measured satisfaction, recommendation, and different aspects of the in-stadium experience, while YouScan continuously monitored the public conversation surrounding the league and its teams from May 28 through August 21, 2026.
Together, the two sources painted a much fuller picture of the season.
And social listening revealed something particularly valuable: the content that generated the most conversation wasn’t necessarily the content generating the most reaction.
The challenge: understanding a league made up of many communities
The WCBL spans the league itself, individual clubs, players, fans, local communities, sponsors and media — with conversations happening across several platforms throughout the season.
Insightrix therefore needed a way to monitor the league and its teams consistently and answer questions such as:
How visible is the WCBL online? How far is that conversation travelling? Which channels matter most? Are teams driving the conversation themselves, or are fans carrying it? What types of stories encourage organic sharing? And where are potential reputation issues appearing?
Using YouScan dashboards, Insightrix could track mentions, engagement, platforms, post types, topic tags, and automated sentiment while retaining access to the underlying posts behind the metrics.
That made the research useful for two distinct cases:
Brand health tracking — following the scale, reach, sentiment, and evolution of conversation throughout the season. Campaign analysis — comparing owned and earned performance, channels and content themes to understand where communication investment was actually producing engagement.
More than 32,000 conversations across one season
Across the monitored season, YouScan identified:
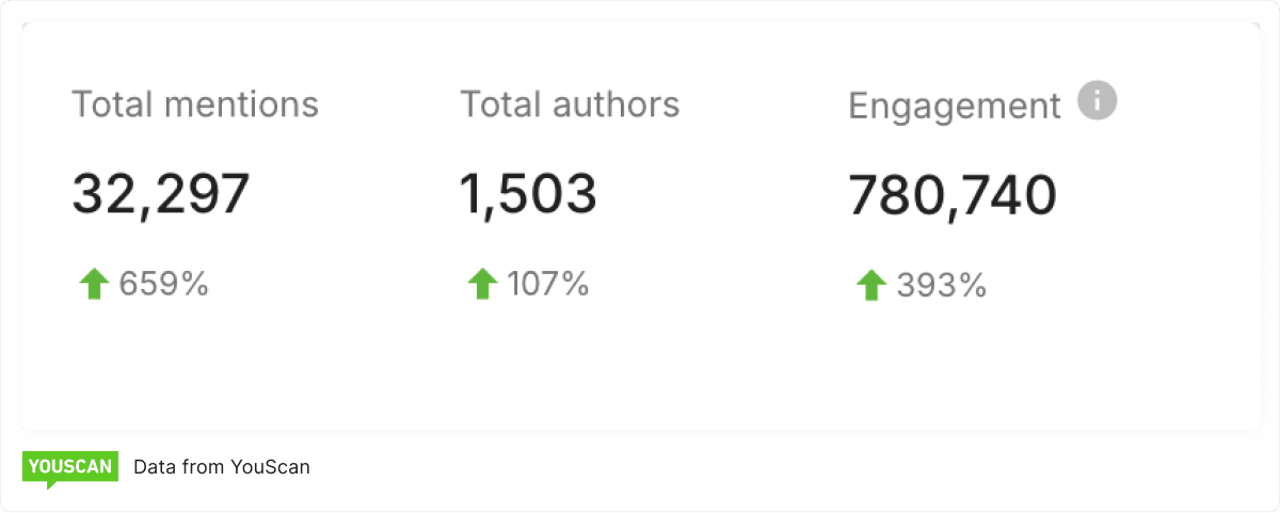
32,297 mentions
780.7K engagements
15.4M views
The conversation was overwhelmingly social: 96% of mentions came from social networks, while mass media generated 1,168 mentions, representing around 4% of the monitored conversation.
For the WCBL, this created a season-long baseline for digital brand health rather than relying on isolated campaign reports or individual account analytics.
It also allowed Insightrix to look beyond the league’s own publishing activity and understand what happened once its content entered the wider fan ecosystem.
The audience created more conversation. The teams created more reaction.
One of the clearest findings came from comparing owned content from league and team accounts with earned conversation generated by fans, media, and others.
Earned sources produced 58% of mentions, compared with 42% from league and team-owned accounts. But engagement told almost the exact opposite story. League and team content accounted for 92% of all engagement, while earned conversation generated just 8%. On an individual-post basis, the difference becomes even clearer:
A typical owned post generated approximately 53 interactions per mention, compared with around 3 for earned content. That doesn’t mean earned conversation was unimportant — quite the opposite.
It showed Insightrix and the WCBL that the opportunity wasn’t simply to make teams publish more content. The bigger opportunity was to help highly engaging owned content escape the team account and become something fans wanted to redistribute themselves.
That changes the question from:
“How do we create more posts?”
to:
“How do we turn the content that already gets attention into something fans help spread?”
Owned | Earned | |
Share of mentions | 42% | 58% |
Share of engagement | 92% | 8% |
Engagement per mention | 53 | 3 |
Facebook creates scale. Instagram creates reaction.
Looking only at overall social volume could easily lead to the wrong channel strategy.
Facebook generated 56% of all mentions, making it by far the largest platform by conversation volume. Instagram represented only 13% of mentions, but Instagram produced 62% of all engagement.
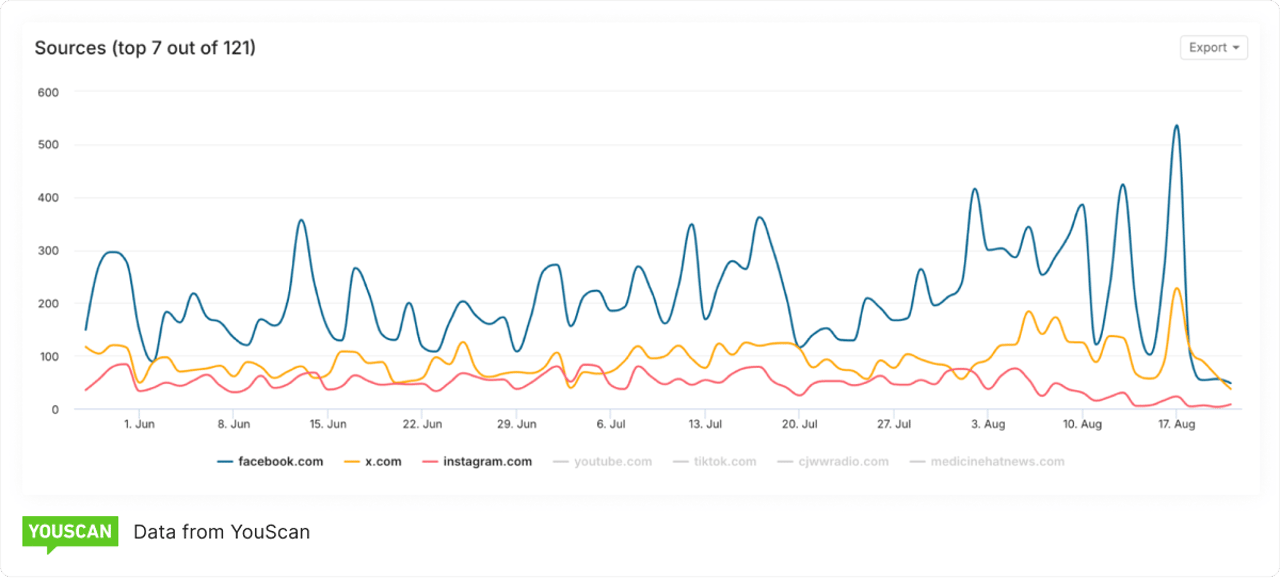
Facebook, despite having more than four times Instagram’s share of mentions, generated 31% of engagement. X accounted for 24% of mentions but only 3% of engagement. The difference becomes even more dramatic at the post level.
According to the analysis, Instagram averaged approximately 116 interactions per mention, versus 13 on Facebook and 3 on X. So the strategic takeaway wasn’t simply “Instagram performed best.” Each network was doing a different job.
Facebook offered conversation scale. Instagram concentrated audience reaction.
💡Pro Tip: For teams deciding where to invest creative resources, that distinction matters. A platform responsible for a relatively modest portion of the conversation could still be the most valuable place for highly engaging content.
Reputation lives in the comments
YouScan also helped Insightrix identify where negative conversation was actually happening. During the monitored period, there were 896 mentions automatically classified as negative; of those, 782 were comments.
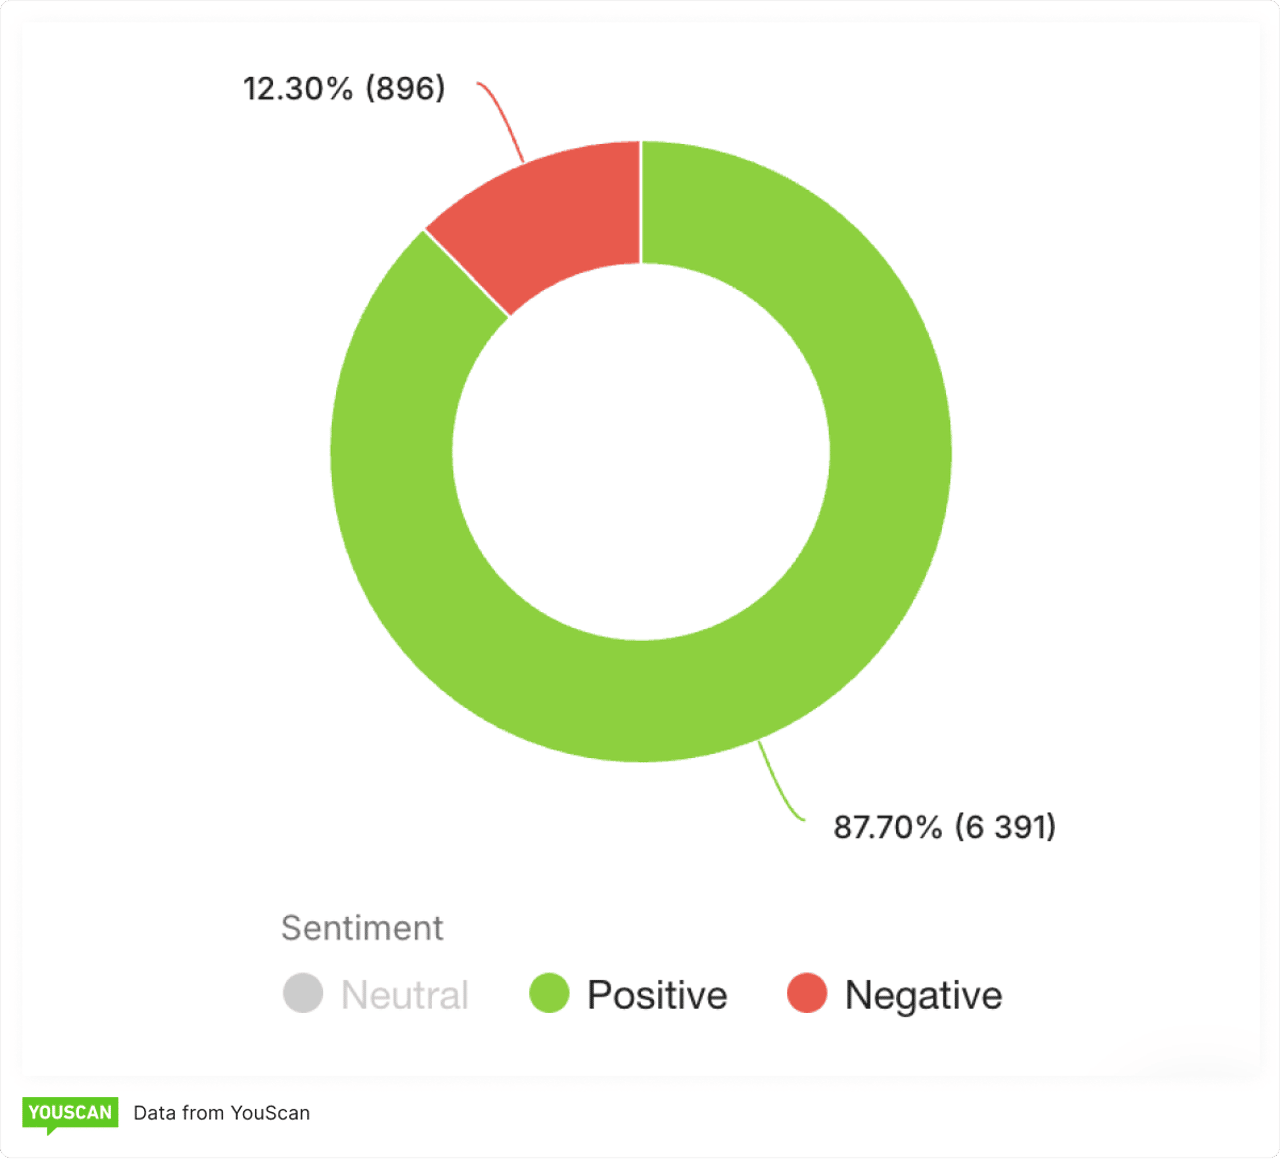
In other words, 87% of all negative-labelled mentions appeared inside comment threads.
That finding changes where reputation management happens. A brand looking only at original posts could see a relatively healthy feed while missing problems developing underneath those posts.
For a sports organization, comments can contain everything from complaints about tickets and game access to weather disruptions, venue experiences, and other operational frustrations.
The implication for the WCBL was practical: community management needed to be treated as part of brand health monitoring, with clear response expectations and escalation paths for recurring issues.
As the stakes increased, fans increasingly took over the conversation
The season also showed how the balance between owned and earned conversation changed over time.
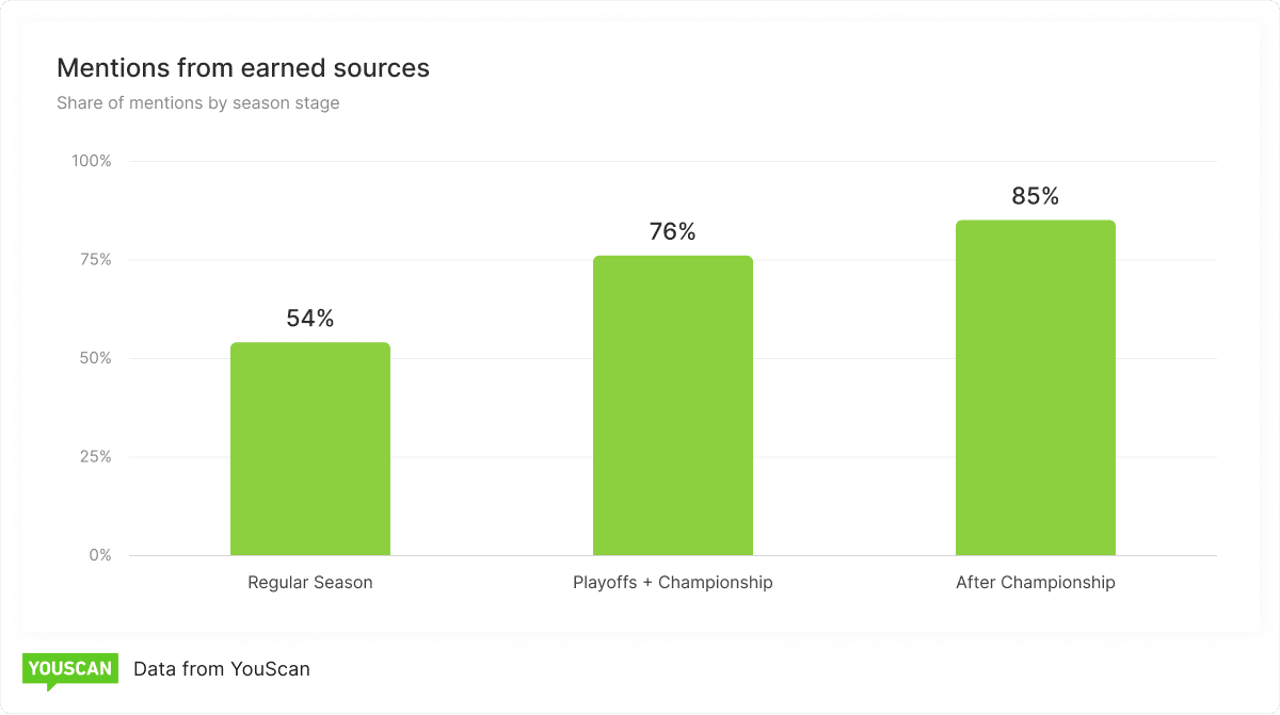
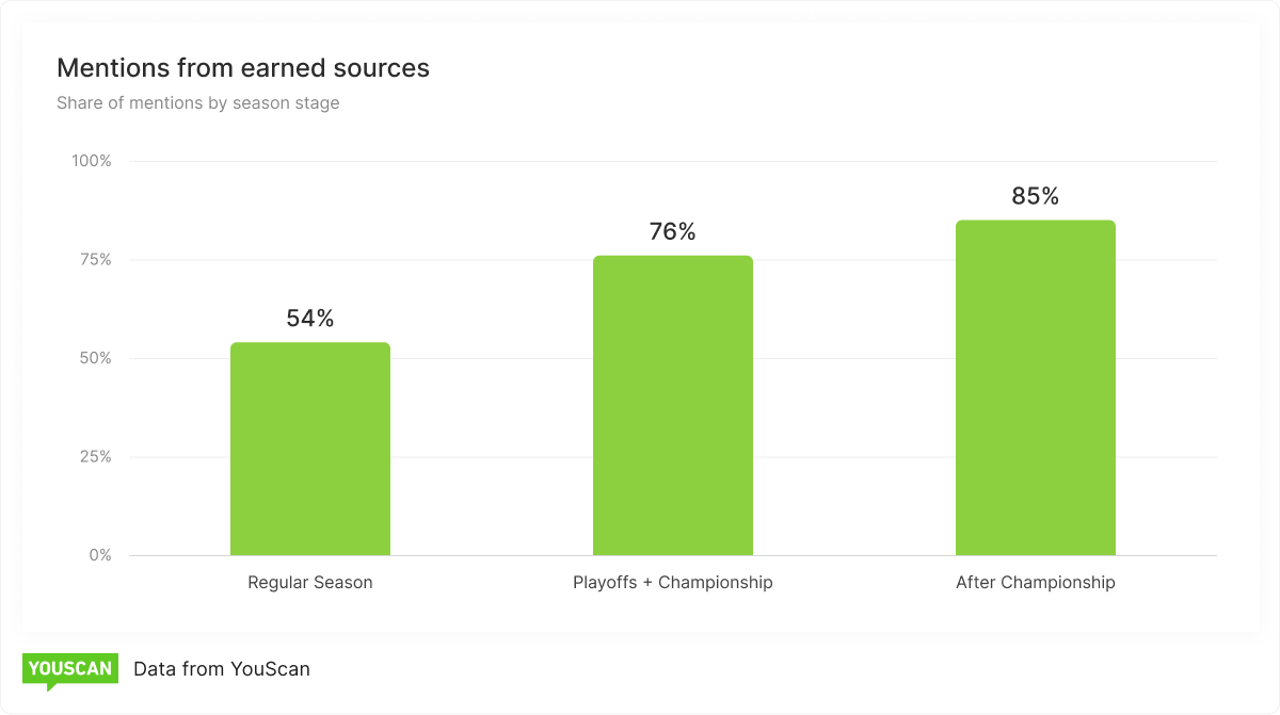
During the regular season, 54% of mentions came from earned sources, this number increased to 76% during the playoffs and championship.
After the championship, earned conversation reached 85% of mentions, even as official team publishing began to slow down.
That pattern gave Insightrix another important insight.
Major moments act differently from everyday content.
During regular-season communication, league and team accounts play a large role in generating activity. But as excitement increases around tentpole moments, the conversation becomes progressively more audience-driven.
In other words, the biggest moments don’t just create more visibility.
They create participation.
What fans share tells you what they care about
Insightrix also used YouScan topic tags to look at different types of WCBL content.
And here the pattern became even clearer.
Player Spotlight content had the highest earned share, with 73% of mentions coming from earned voices.
Community Events followed at 67%.
By comparison:
League-level WCBL content: 53% earned
Game Day content: 41% earned
Sponsor Mentions: 36% earned
People, apparently, are more shareable than logos.
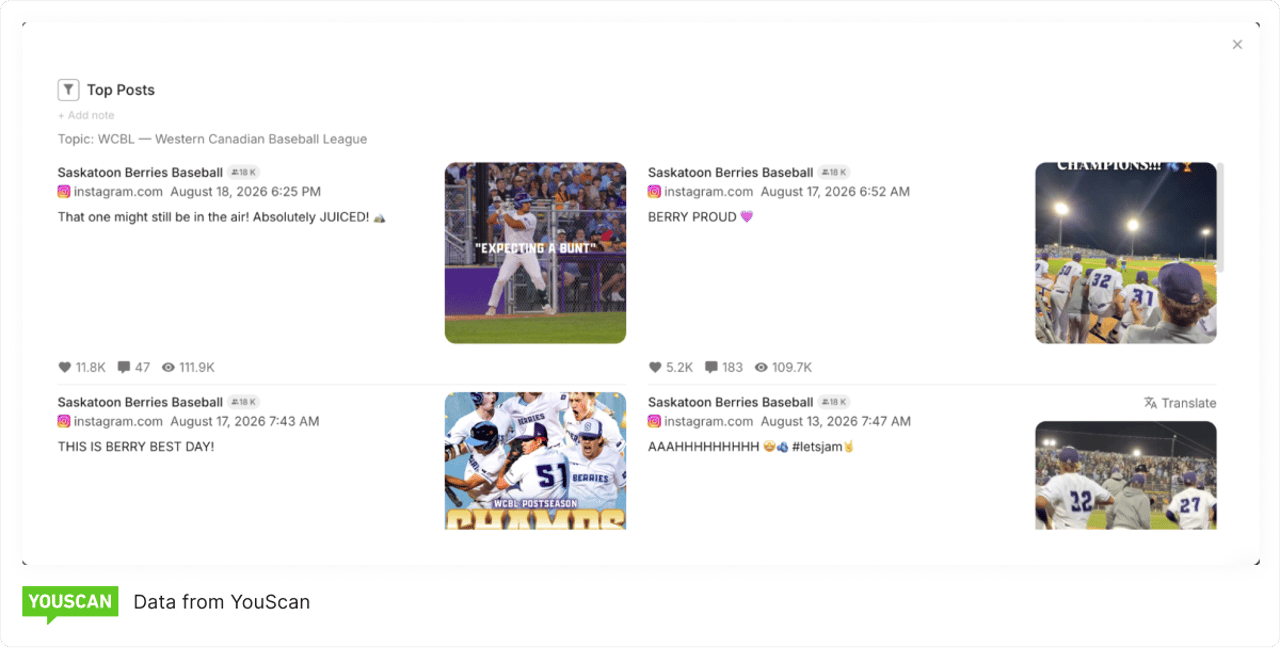
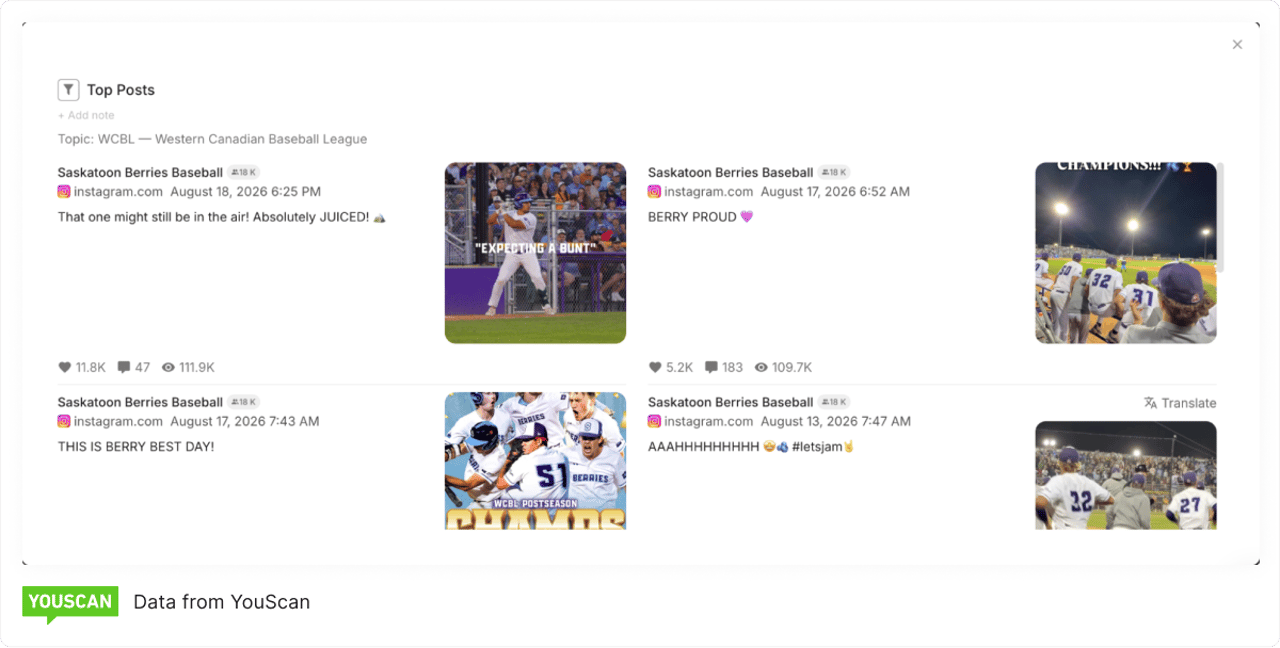
The data suggested that stories built around players and community participation naturally travelled further into the fan ecosystem, while explicitly sponsor-focused content remained much more dependent on owned channels.
For sponsorship strategy, that’s a useful distinction.
💡Pro Tip: Rather than treating sponsor exposure as a standalone content category, partners can be integrated into the player and community stories fans already want to share.
That gives sponsorship a chance to participate in organically successful narratives instead of fighting for attention beside them.
Connecting what fans say with what fans experience
One particularly interesting part of Insightrix’s methodology was that social listening wasn’t used in isolation.
The agency paired YouScan’s unsolicited online conversation with a post-game fan experience survey.
The survey asked essentially:
“Did the people in the seats have a good night?”
YouScan answered a different question:
“What did the wider fan base say unprompted?”
The survey found a very strong overall fan experience: 94% overall satisfaction and a +76 Net Promoter Score, with 80% of respondents classified as promoters.
Social listening then extended that picture beyond surveyed attendees.
It showed whether conversations travelled, which moments people voluntarily amplified, where negative reactions emerged, and which channels and content formats transformed attention into engagement. That’s where the two approaches become more powerful together. Survey research can explain the experience.
Social listening can show what happens to that experience once people begin talking about it publicly.
Turning season data into decisions
By the end of the project, Insightrix wasn’t simply handing the WCBL a social media performance report. The combination of research and YouScan translated the season into practical decisions.
The league could see which content generated organic participation, which channels performed different roles, where reputation risks emerged, and when audience conversation began to outperform owned publishing.
What YouScan helped Insightrix uncover
Measure brand health throughout an entire season.
Insightrix tracked more than 32,000 mentions and 15.4 million views, creating a league-wide picture of visibility, engagement and reputation instead of relying solely on owned-channel analytics.
Understand the difference between conversation and engagement.
Fans and media generated the majority of mentions, while league and team content generated the overwhelming majority of interactions — revealing an opportunity to turn strong owned content into more earned amplification.
Identify where different channels create value.
Facebook delivered volume while Instagram dramatically over-indexed on engagement, helping distinguish channels for reach from channels for reaction.
Move from content reporting to content strategy.
Player and community stories travelled organically far more often than sponsor-focused content, providing evidence for how future editorial and partnership content could be structured.
Spot reputation issues where they’re actually happening.
With 87% of negative-labelled content appearing in comments, teams could focus community-management resources on the part of the conversation most likely to contain friction.
Closing
For a league spread across multiple teams and markets, there is no single fan conversation.
Insightrix used YouScan to bring those conversations together — following them across platforms, teams, and different stages of the season and turning them into something far more useful than a collection of social metrics.
The result was a clearer understanding of how healthy the WCBL conversation was, what made audiences participate and which stories had the power to travel beyond official channels.
Because sometimes the most valuable measure of a campaign isn’t how much a brand says.
It’s what happens after everyone else starts talking.