Sponsorship Evaluation: Look Deeper with Computer Vision

Sports are one of the most engaging events where brands can reach a vast audience. Even in the post-Covid era, tournaments garner a lot of interest, including lively social media discussions. In the time of limited budgets, measuring sponsorship effectiveness is the number one priority for marketers. Tracking and analyzing visual content created before, during, and after sponsored events is key for efficient sponsorship evaluation.
Why sponsorship matters and what are the benefits
In the world of decreasing advertising efficiency and shifting social values, sponsorship provides something that other marketing methods do not: a meaningful emotional connection with your target audience. When a brand collaborates with an athlete or a team, it also gains a devoted fan base grateful for the support of their favorite players.
We know sponsorship works, because it strengthens the brand and increases purchase intent among fans. In fact, the audience views such branding as less annoying and even sustainable.
The question remains: how do you measure sponsorship performance with advanced visual analytics?
Metrics to measure sponsorship performance
The yield of sponsorship activities gradually accumulates over time as the trust builds up among fans. While the monetary return is difficult to measure at first, brands should select other relevant metrics for their objectives at a specific event.
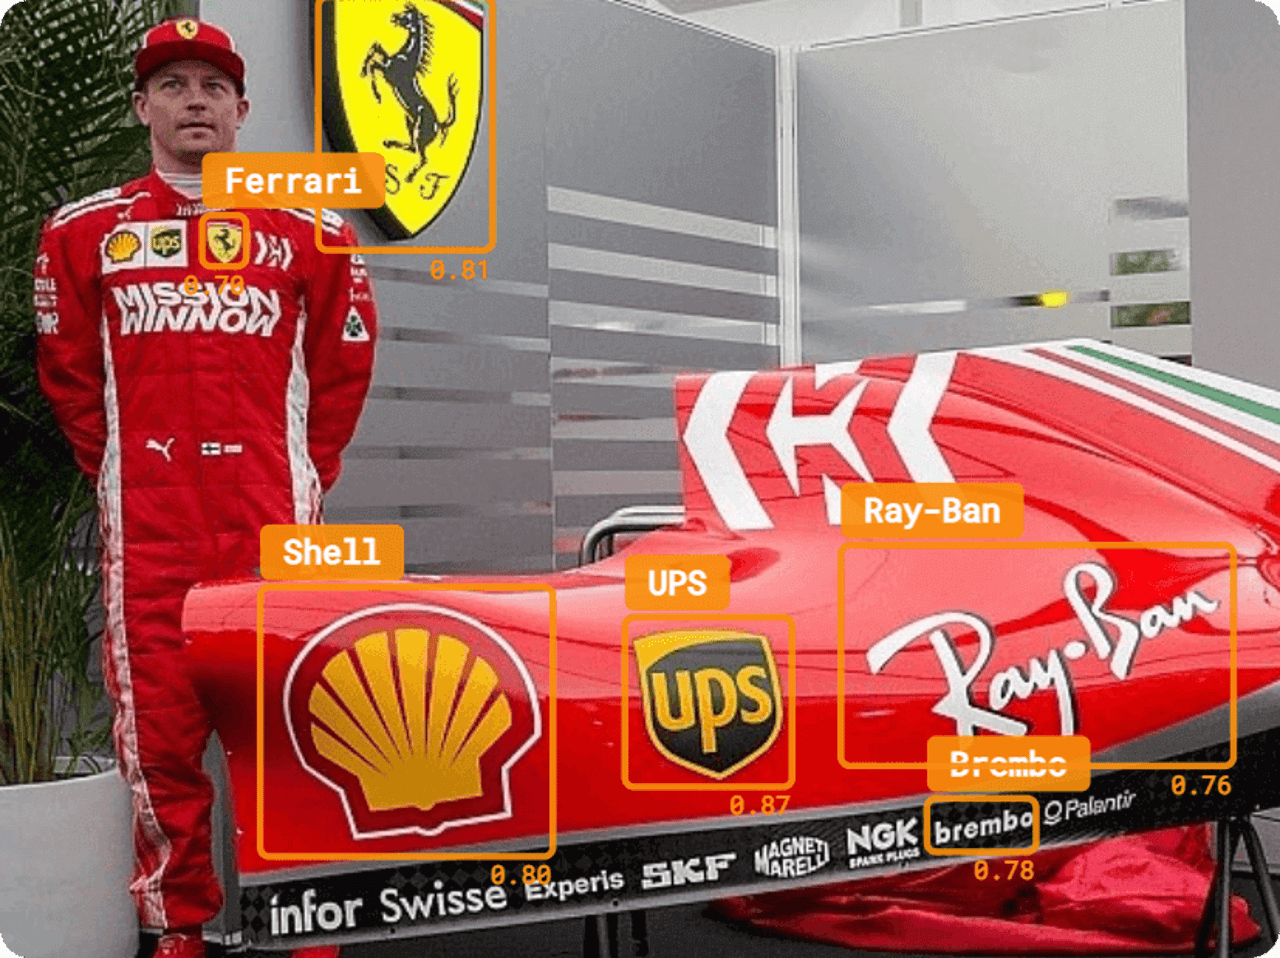
One of the ways to measure the actual impact made in all the digital channels is to use computer vision to track visual brand mentions. YouScan identifies them automatically with an accurate AI-powered logo detection. For example, you can quantify impressions of the sponsored jersey kits or LED banners.
We call them brand appearances, the instances of the sponsor logo featured in an image or a video from the sporting event. They are usually photos taken onsite during the competition and displaying branded items. The total number is a good ballpark estimation of the overall sponsorship exposure.

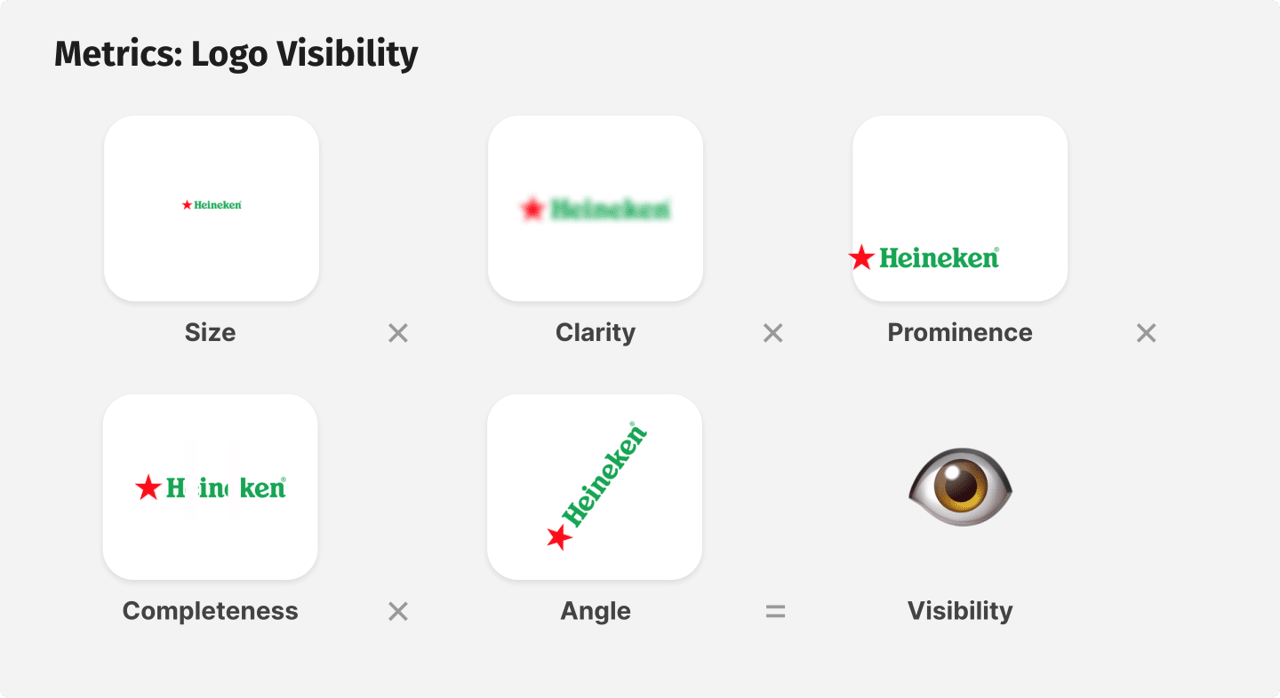
Next comes logo visibility, an indicator of promotion quality in a particular impression. Brand visibility is calculated based on the following weighted criteria: size, clarity, prominence, completeness, and angle. Average logo visibility measures the efficiency of the sponsored properties for a particular brand. If you find that the logo has poor visibility, it is probably time to improve your placement.

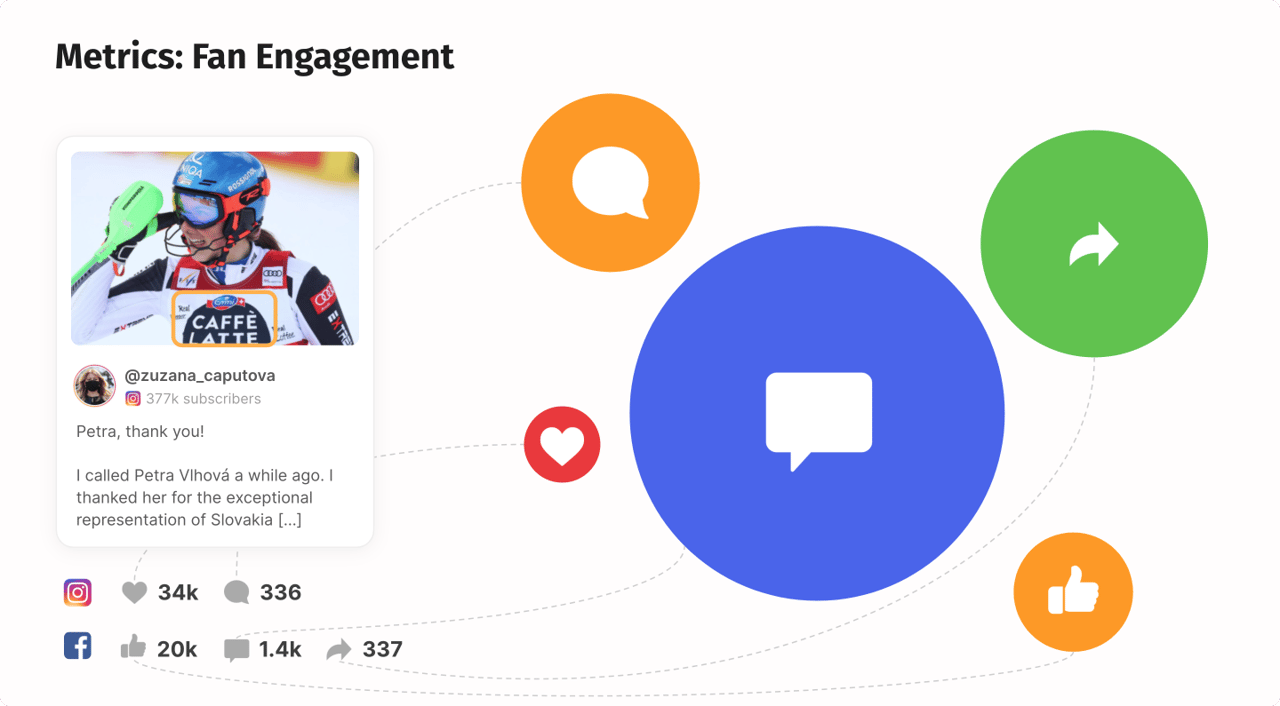
Another powerful metric is fan engagement, which estimates the impact of brand appearances on readers and viewers. It’s an adaptive score based on user reactions. Likes have the least weight, while comments and shares are better indicators of genuine interest, drawing more attention to the sponsored content.

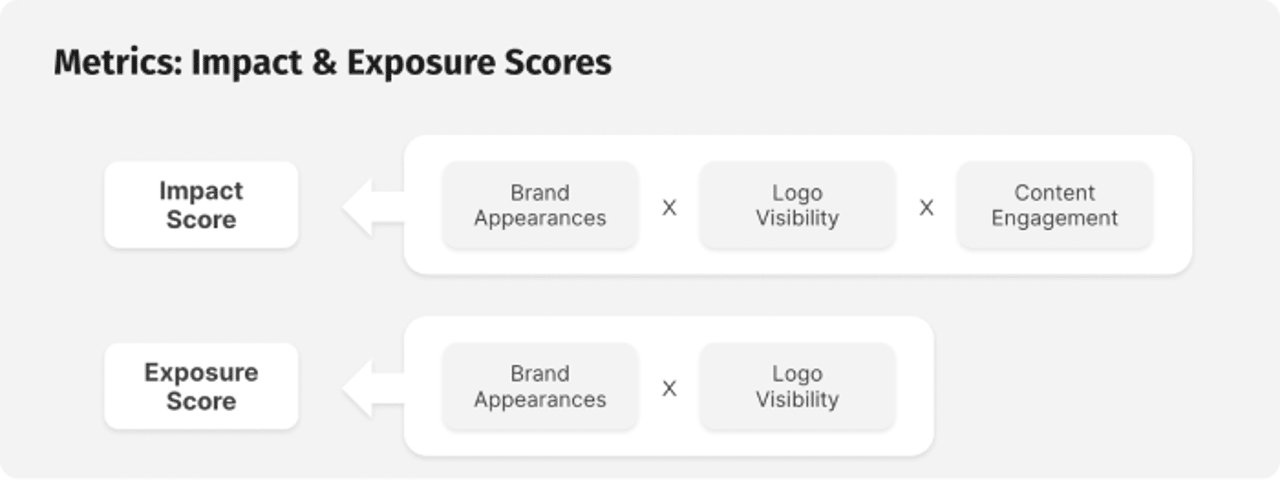
Equipped with full details on visual properties and participation size, we can finally evaluate the success of the sponsorship and review it for each channel.
Impact Score measures the volume and quality of visual mentions, as well as their amplification on social media.
The same type of grade for digital media (such as online news websites) is the Exposure Score. It lacks engagement data but is still a good indicator of the sponsorship value generated for a particular brand.
These sponsorship performance metrics summarize the return on investment across all the channels. Even when using a different framework for calculating these figures, you can still access the raw data and get a custom view of what's most important for your brand.

The last metric to consider is Share of Voice, a percentage of attention grabbed by each brand, calculated by dividing their scores discussed above by the sum of these scores for all the sponsors. It allows brands to understand why some programs produce better results than others, and learn from them to improve sponsorship performance in near real-time.
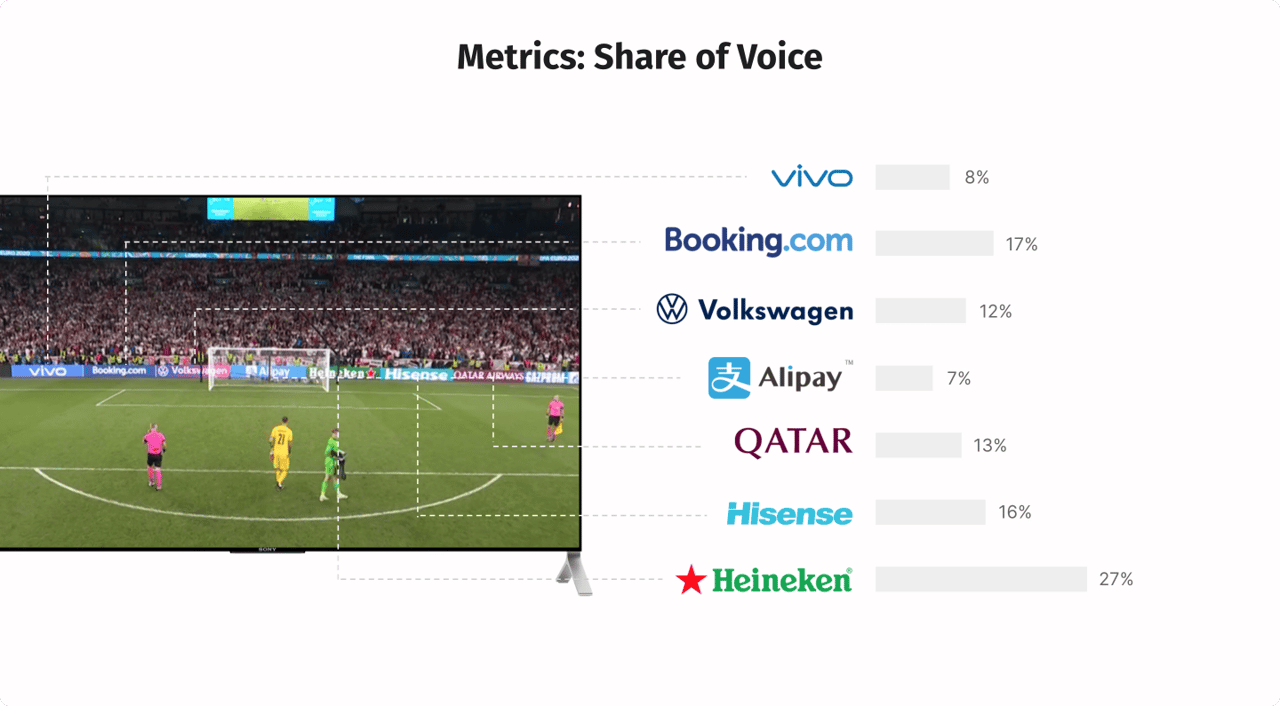

Sample sponsorship evaluation report
We prepared a detailed 25-page sample report for the Ski World Cup final so you can see all of these techniques in action. Download it for free here.
The document contains performance metrics based on real-world data and includes brand scorecards for seven official sponsors. Each overview begins by defining marketing objectives, followed by suggestions for maximizing sponsorship ROI.
You can achieve the same results through the self-service capabilities of YouScan. You can also choose to request on-demand research from us. Drop us a line, and we'll use the full power of computer vision to look into the details of your sporting event.


-1721912988.png)

.png)