Visual Insights 2.0
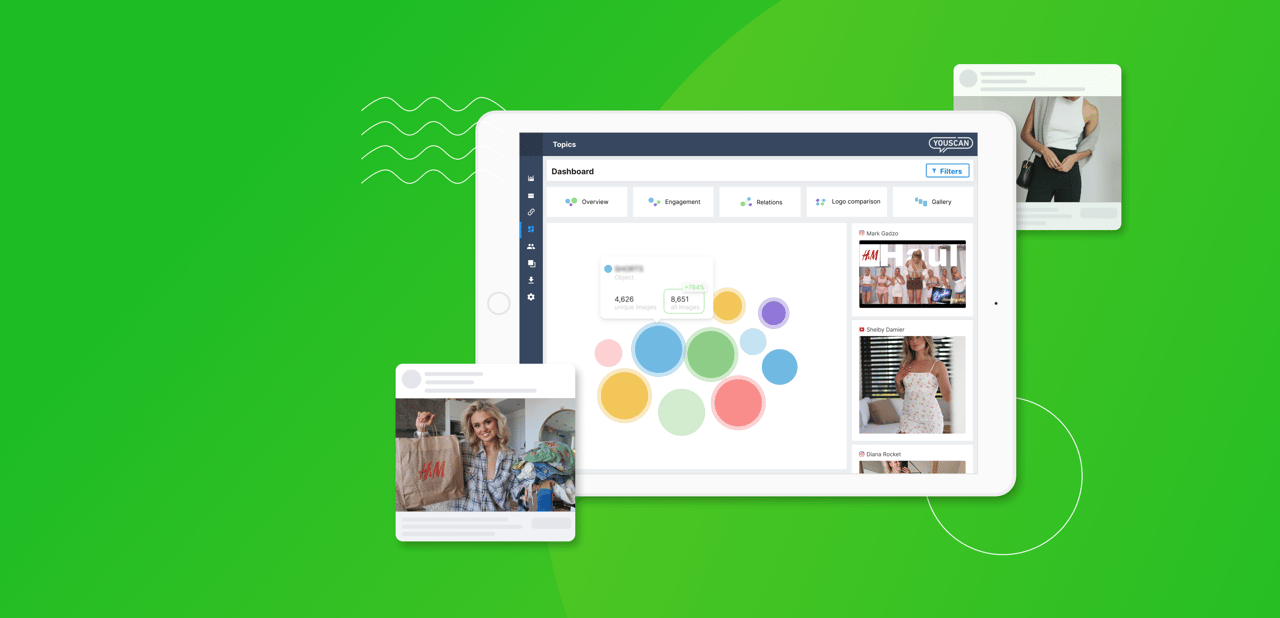
Users upload over 3 billion images on social media daily. Brands can uncover vital customer insights from these images with visual listening. YouScan's new features will help marketers analyze this data even deeper, spotting trends, relations, and non-obvious ideas.

We've started our updates with slight interface changes: now, all features for image analysis are placed together. The section consists of Overview, where the images that most frequently appear in your topic can be seen; the familiar Engagement Chart, well-known and well-loved by YouScan's clients; a new Relations chart, a Logo comparison feature, and Gallery with all topic-related images.

Trends in Visual Insights
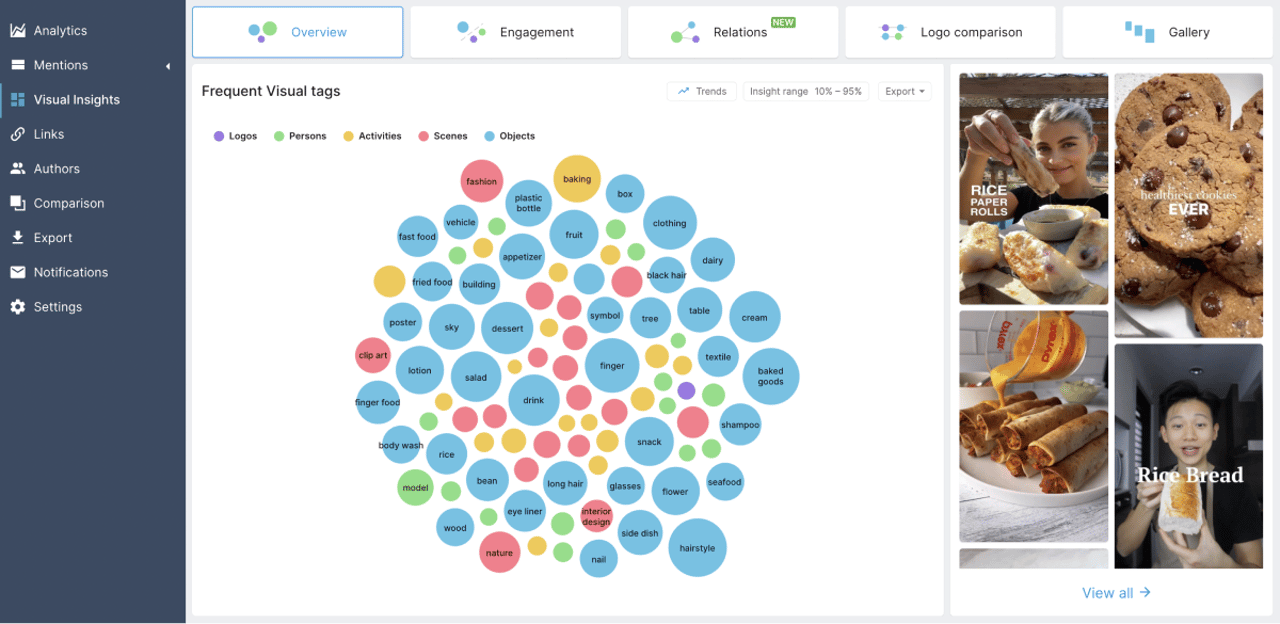
Recently we’ve updated a bubble chart that helps analyze the most common activities, persons, scenes, objects, and logos on social media images.
Now, this chart allows you to monitor visual trends that gain popularity.
You can set any date range and learn which image categories users increasingly shared on social media during that time.
Sportswear, for example, became an even more popular object in H&M-related photos in March. Knowing this, brands can better understand clients changing preferences and focus on them in their future marketing campaigns or create more relevant social media content.
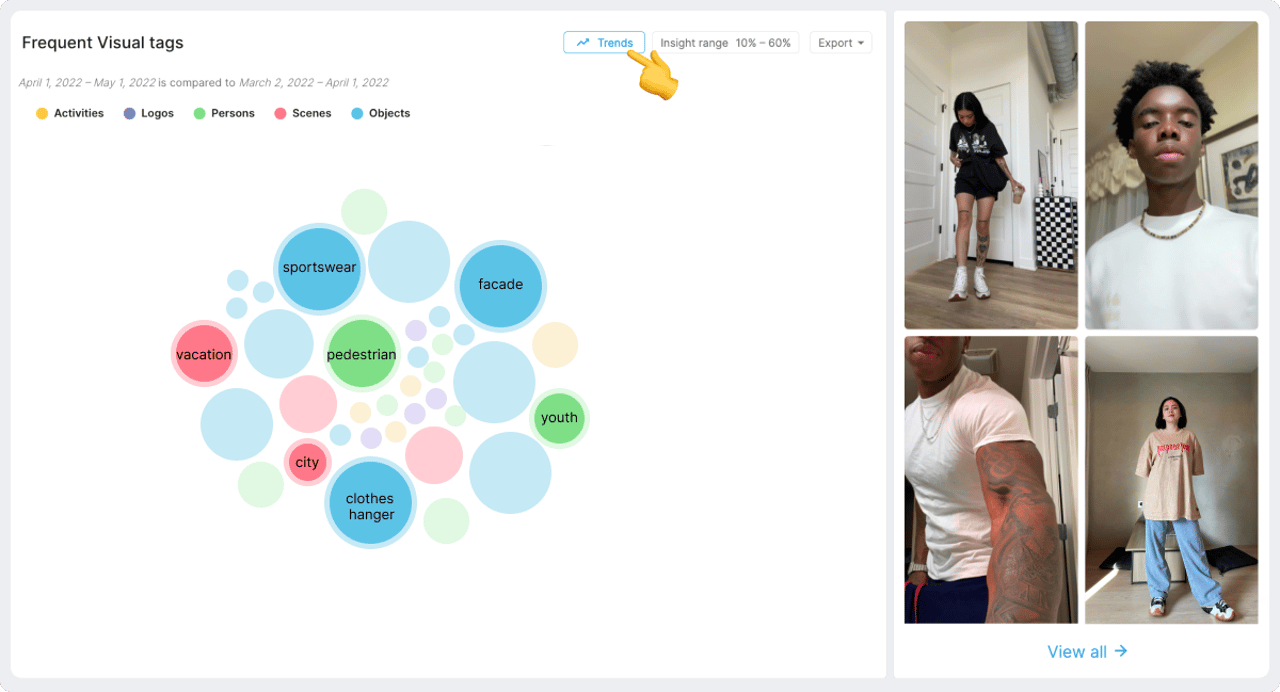

To see images that don't appear as frequently, you can use the Insight range slider. Toggle the slider from 0% to 100% to see more or less common photos in the chart. The smaller the percentage, the less frequent the contents of images the chart shows. This feature comes in handy when marketers are looking for unexpected visual combinations.
For instance, in the case of fashion brands, it's obvious that for lots of them, “men” or “women” would be the most frequent persons in the pictures. To make this analysis more insightful, you can choose a lower percentage in the Insight range. For H&M, the less evident persons are kids, family members, and brides.
-1654888667.png)
-1654888667.png)
Using this feature, marketers can uncover the most valuable insights, not wasting time on analyzing obvious information.
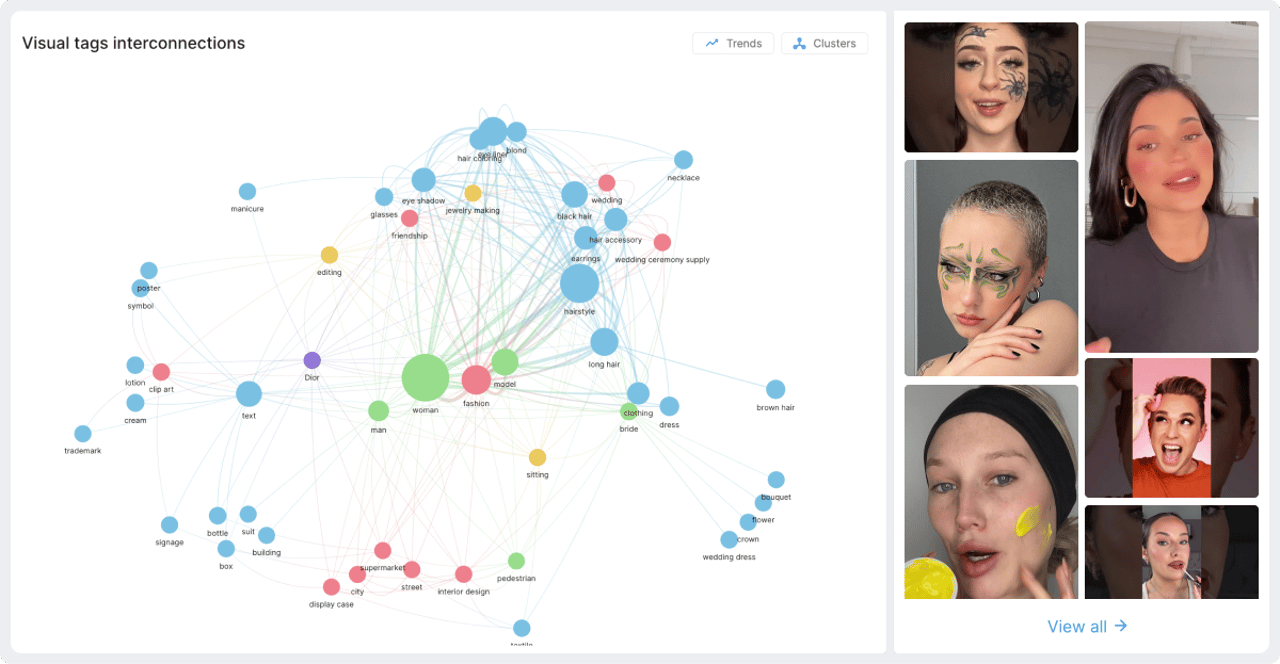
Relations chart
Just knowing the contents of images is not enough; it's also helpful to find out how the different objects relate to one another. For this task, we've created a Visual tags relations chart. Based on the size of the bubbles, you can see how frequently the particular images appear in user content. Threads between them represent how different contexts are linked.
The more frequently different objects, scenes, persons, and activities appear in the same image, the closer the bubbles are placed to each other.

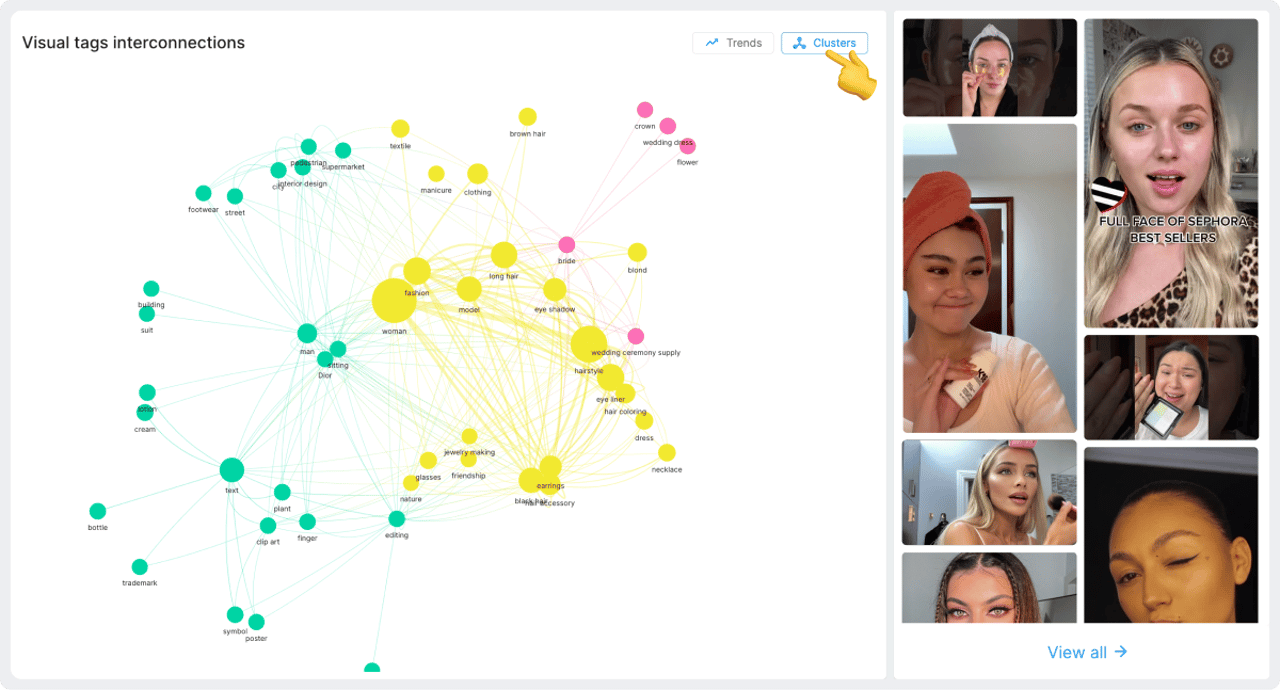
For more details, you can tap the clusters button and see the connections between pictures that are often posted together. Connected items are highlighted with the same colour.
For instance, in Sephora-related pictures, blond hair often appears with flowers, wedding dresses, and crowns. This information can be used for future brand visual communication campaigns.
By clicking on each bubble on the left side, you can see the images that this bubble represents.

YouScan’s Visual analysis capabilities were recognized as the best in the industry by Saas Advisors. We will keep improving this functionality to provide brands with unlimited access to customers' insights. Stay tuned!
If you want to try new YouScan features, just request a free demo.