Updates Digest: Smart Tags, Net Sentiment Rate, new monitoring sources and Visual Insights Engagement chart
We at YouScan meet 2021 with new product updates of our system.

Now our system has more useful features such as Smart Tags, Net Sentiment Rate, Quora and Reddit monitoring, and Visual Insights Engagement chart.
Let's move to the detailed explanations:
Smart Tags
The more data you have – the more time and effort you need to process it. Since YouScan can monitor thousands of brand mentions a day all over the social networks, our team has implemented a new feature that helps our users automatically segment these mentions by your company-specific categories – Smart Tags.
Depending on your business, the system divides mentions into different categories that best correspond to the sense of these mentions. For example, if you represent a bank, you might monitor such topics as ATMs, customer service, fraud cases, etc. Using Smart Tags allows you to automatically mark mentions according to these categories and assign the responsible departments to handle them.
Smart Tags help make the process of segmentation easy, fast, and more efficient. Since the feature is based on machine learning, it can recognize different aspects and criteria to put the right tag on each mention. The only thing needed to enable the Smart Tags feature is to give the system some references to learn on. After that, an algorithm runs automatic segmentation for you.
You can read more about Smart Tags in the dedicated blog post.
Net Sentiment Rate
YouScan has the Sentiment Analysis feature for a long time as we understand the importance of monitoring the tone of brands discussion. Now we introduce an additional metric that helps to follow sentiments in dynamics.
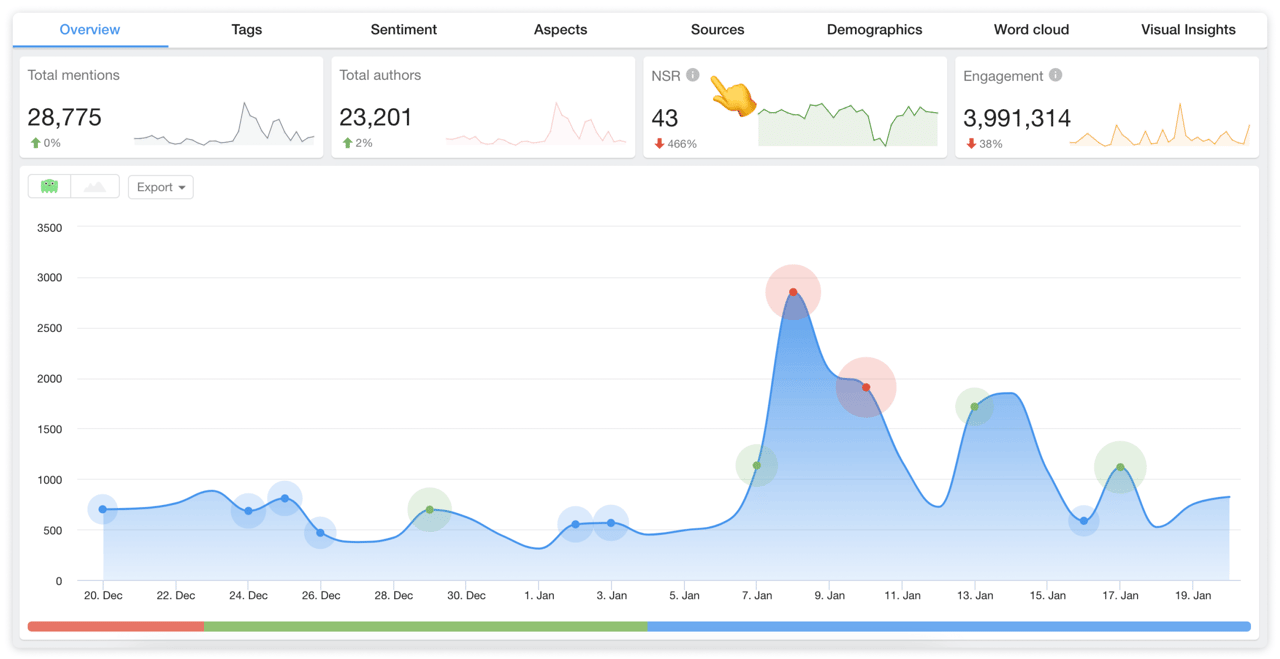
With the new update, our clients can discover the Net Sentiment Rate (NSR) – a metric showing a real-time customer satisfaction level.
How do we calculate it? NSR is the ratio of positive and negative mentions in a specific sphere during the chosen period. It can score positive (above 0), negative (below 0), or neutral (0).
You can set different periods to analyze your performance over time and make changes to your strategy if needed.
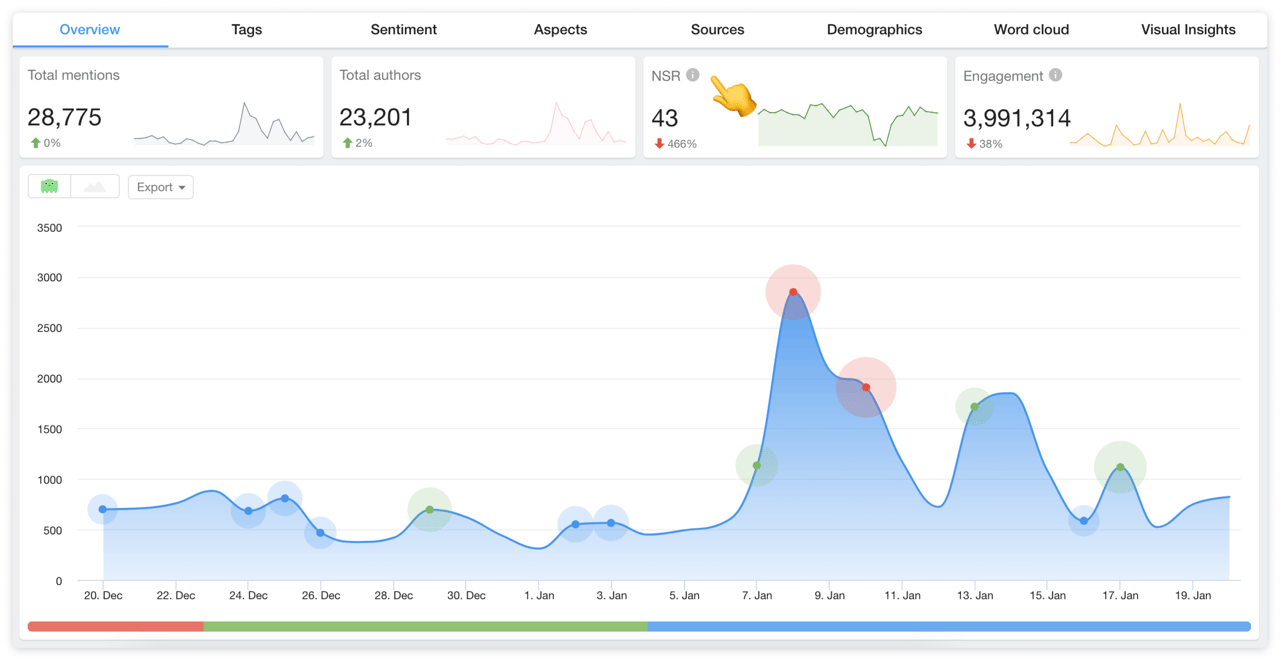
VS
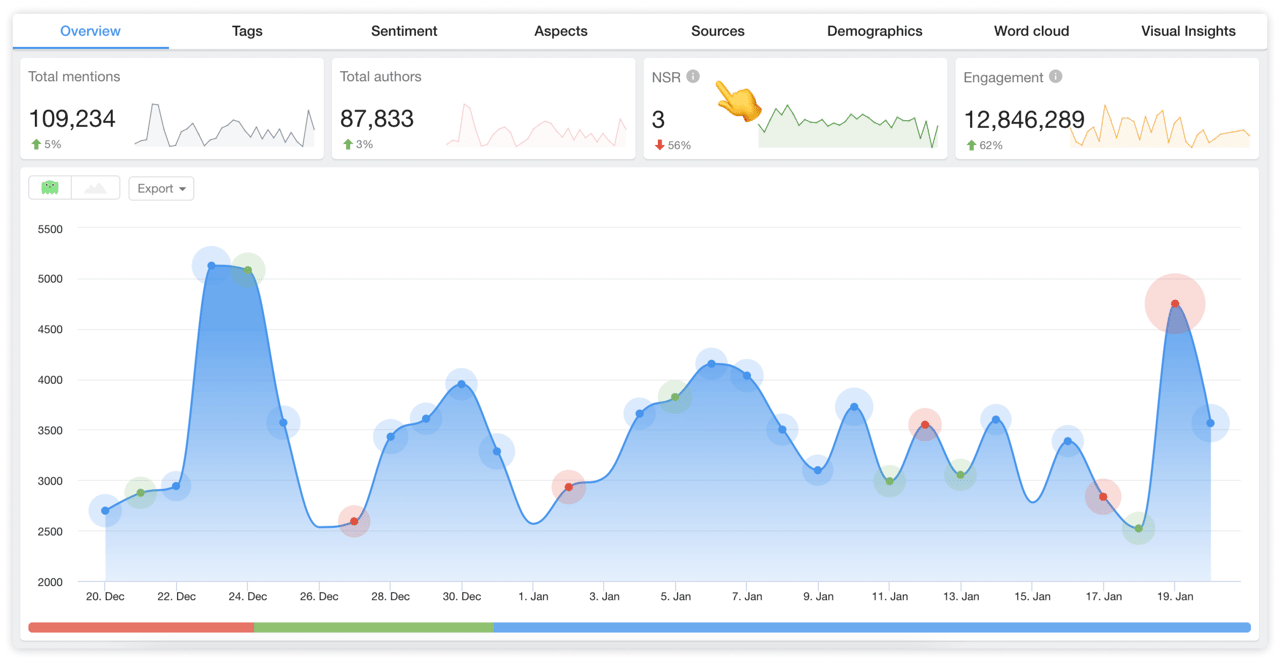
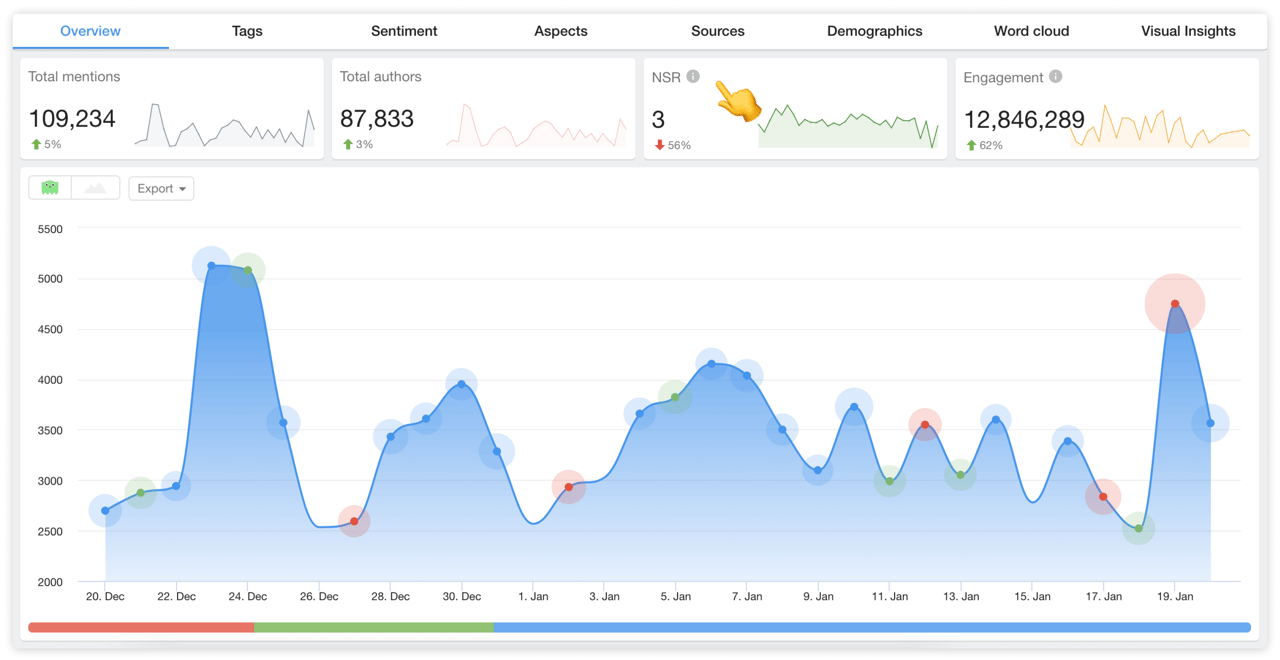
For example, Burger King has NSR 43 while its competitor KFC has only 3, which means that KFC has a lot of work ahead to increase this metric.
Quora and Reddit monitoring
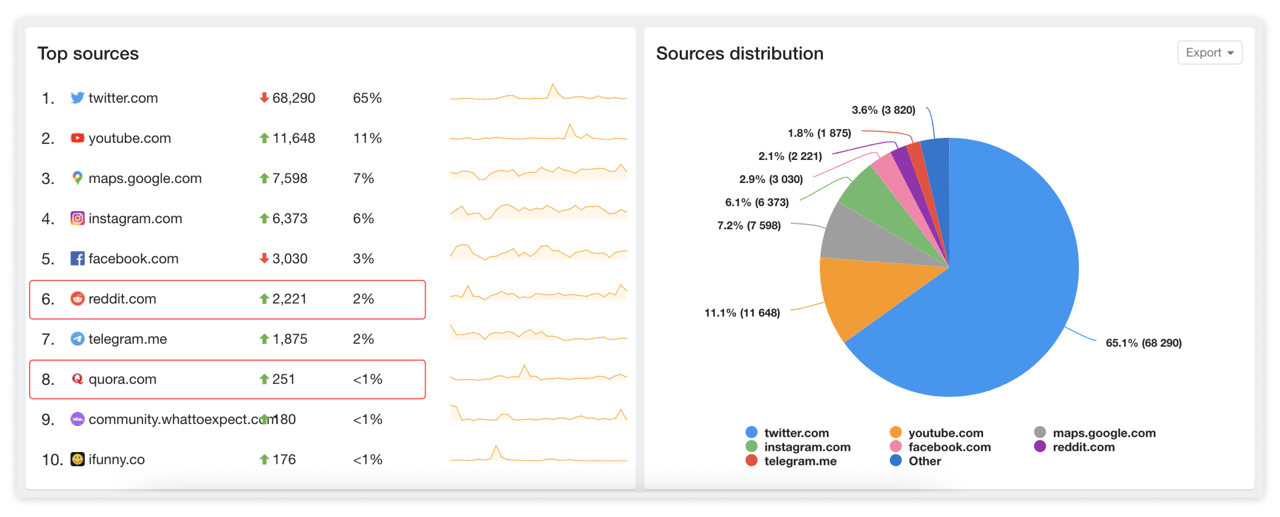
With the latest update, you can also get more insights from the leading discussion and Q&A platforms: Reddit and Quora. They can be found in the Sources tab in the Mentions menu.
According to Similarweb, Quora has over 500M visits monthly while Reddit has reached almost 2B visitors per month, and its traffic is growing with time. These numbers are convincing enough to understand why it's critical for brands to monitor these social platforms.
We collect the following data for you:
- posts and comments from Reddit;
- questions, answers, and comments from Quora.
This update would be handy for everyone analyzing global markets.
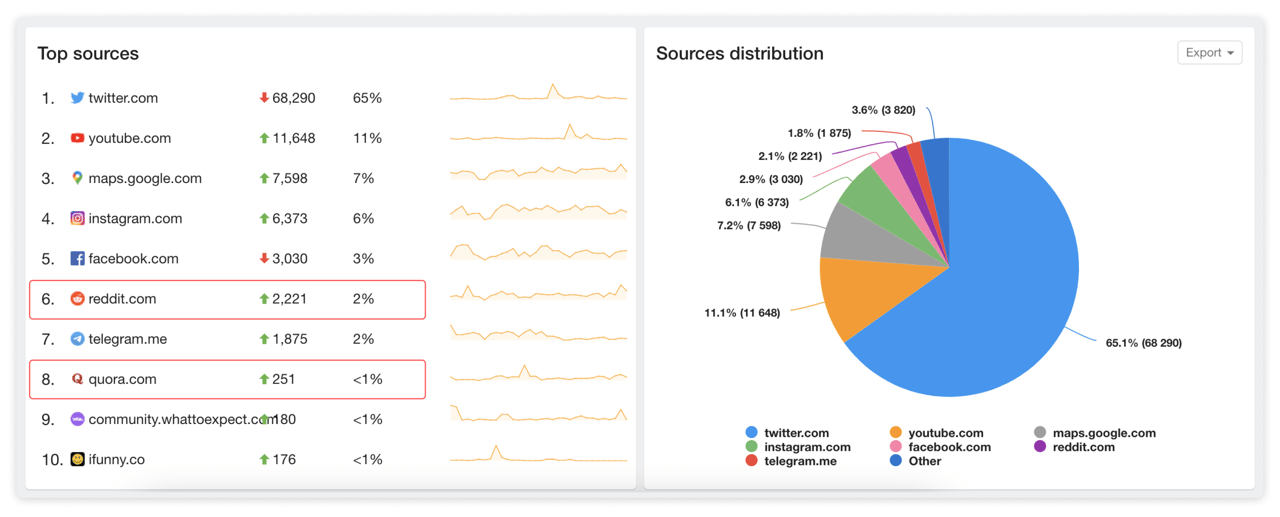
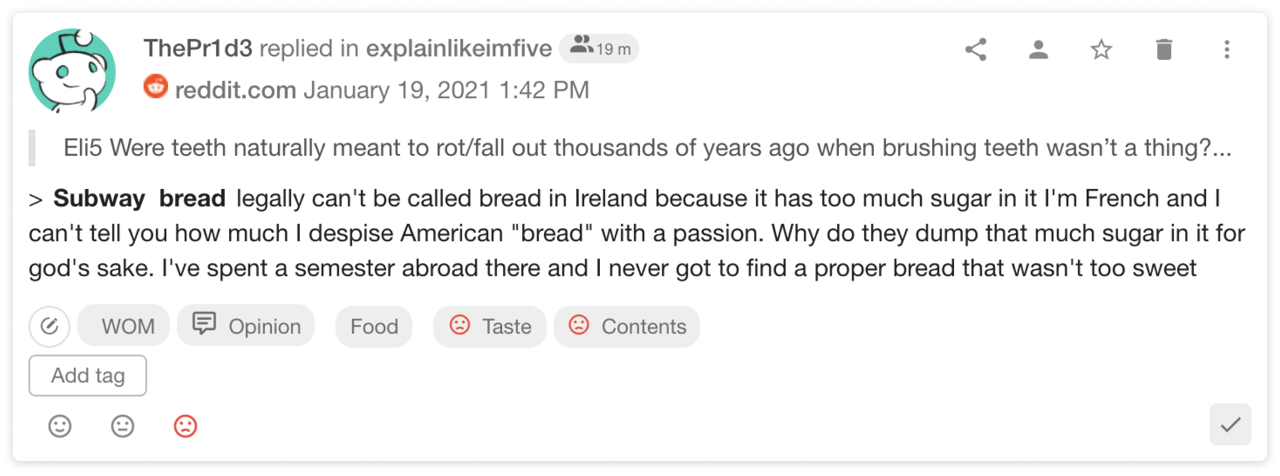
For example, Reddit and Quora are in the top 10 sources where Subway is mentioned. Besides, Reddit and Quora's main trait is that people are used to sharing their experiences about brands in detail. That's why tracking these websites is crucial for any brand.

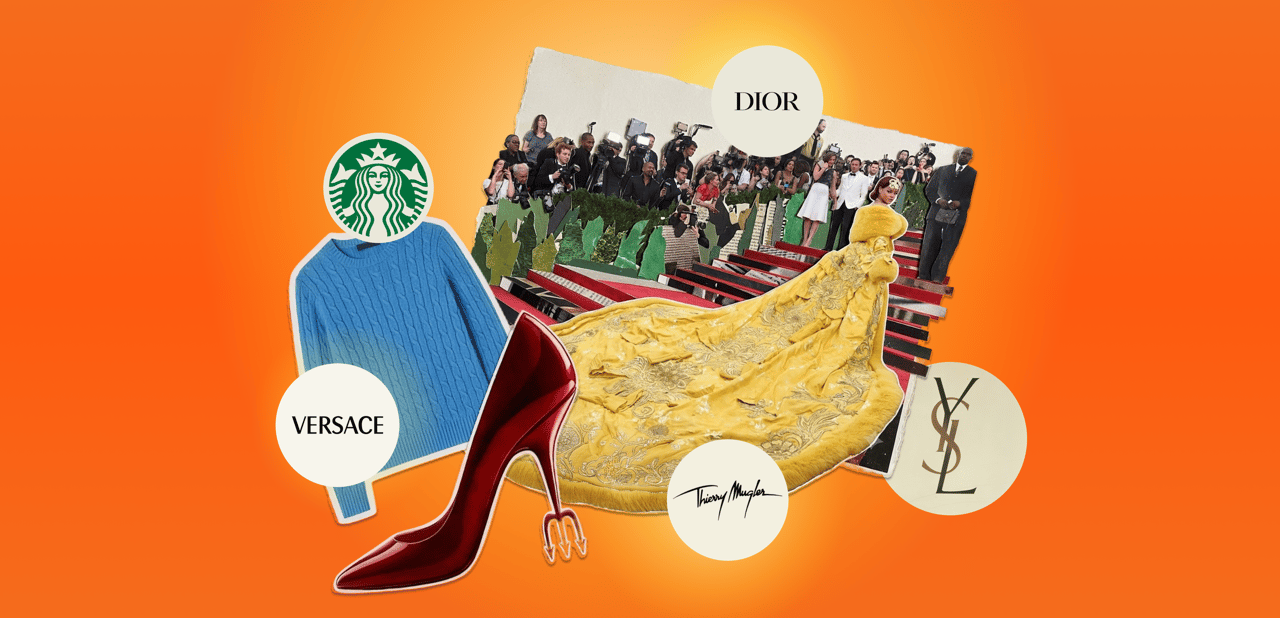
Improved Logo Comparison
You might have seen the Logo Comparison feature in our previous digest. In brief, it is used to analyze the context in which your brand's logo appears on images compared to your competitor's logo.
With the new update, the system automatically selects options for scenes, objects, persons, and activities featuring your logo that differ the most from competitors.

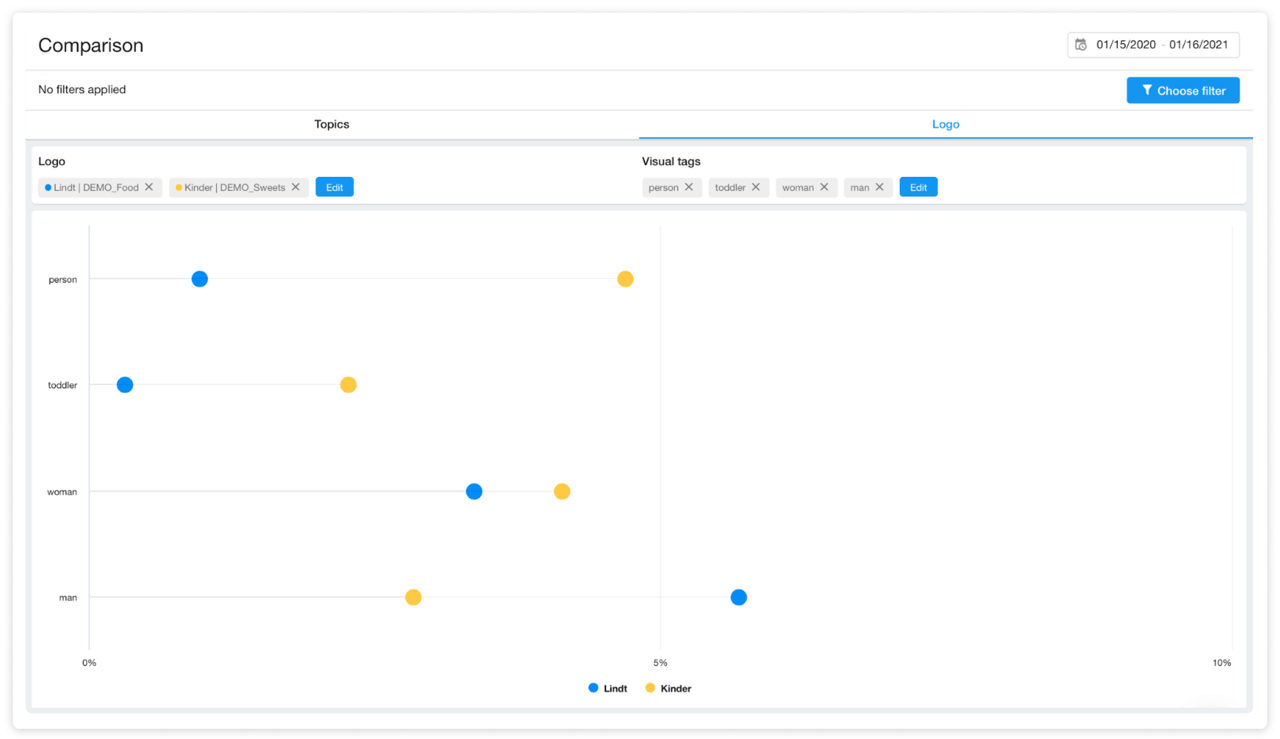
Let's take the example of Kinder and Lindt sweets. The Kinder logo appears mostly on images together with children and women, while the Lindt logo pops up next to men.
However, you don't have to focus on scenes, objects, persons, and activities suggested by the system. You can always select them manually according to your particular needs.
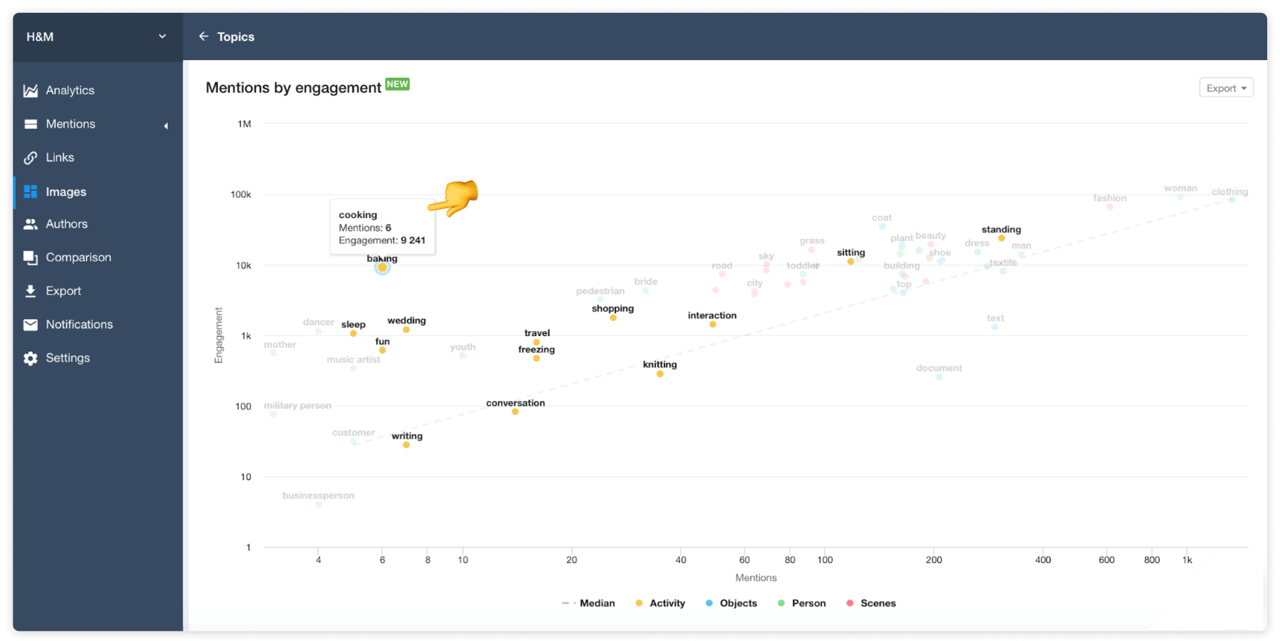
Visual Insights Engagement chart
Visual analysis is one of the core features of YouScan, so we continuously develop it to make it more powerful and valuable for our clients.
Now when you can monitor the brand's mentions that don't contain a brand tag or even text, we have added an extra feature called Visual Insights Engagement Chart.
VI Engagement Chart allows you to discover which type of visual content has more engagement than others in general, as well as analyze in detail which objects, scenes, people, and activities are more engaging.
VI Engagement Chart is one of the tools you can use to find meaningful insights about your brand, industry, or customers.
This information can help build a marketing and communications strategy and create even more appealing content or analyze the completed ad campaigns.
Brands can also use this feature to find influencers in their niche who have the most engaging content and build relationships with them. These are only a few cases out of many on how VI Engagement Chart can be used.
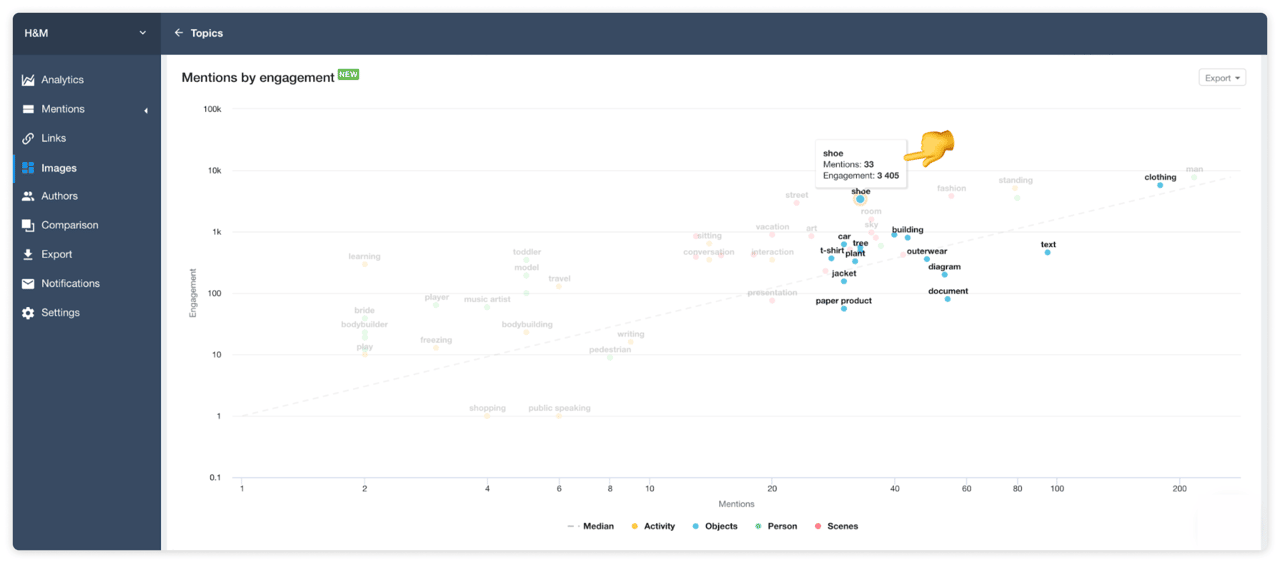
For example, the first association with H&M is clothing. However, if you analyze the visual content, most popular among men, it turns out that shoes are even more engaging than clothes.

There is a similar situation with the female audience. The most popular object in images is a coat, while traditionally, women are associated with dress. Moreover, it turns out that "cooking" is even more engaging than "clothing" when analyzing scenes, which directly references the H&M Home line.

You can read more about Visual Insights in general here.
Visual Insights Engagement Chart is available in Insight and Enterprise pricing plans.
Would you like to find out what people say about your brand online? Request our free demo.