Social Media Benchmarks for Brands: Engagement Rate, Word of Mouth and Sentiment by Industry



The Ukrainian advertising market keeps shifting toward digital platforms and formats. For three years in a row, investment in social media marketing (SMM) and influencer marketing has grown alongside classic digital media tools. But as budgets grow, so does the obvious question: is this spend actually working? How do you measure the impact of content that can't be reduced to familiar media metrics like reach and frequency?
Publicis Groupe Ukraine and YouScan analyzed more than two years of social listening data across eight industries to build the first social media benchmarks for Ukraine — and to show brands how to work with the right social media metrics systematically.
Key benchmarks at a glance
Average engagement rate: 6.2% across all content in 2025 (up from 5.2% in 2024); 6.9% for user-generated content.
Highest engagement by industry: pet food (7.8%); lowest: banks (3.8%).
Engagement by platform: 27.1% on TikTok vs. 0.8% on Telegram and X (Twitter).
Word of mouth: about one-third of all social mentions come from real users (33.2% in Q1 2026).
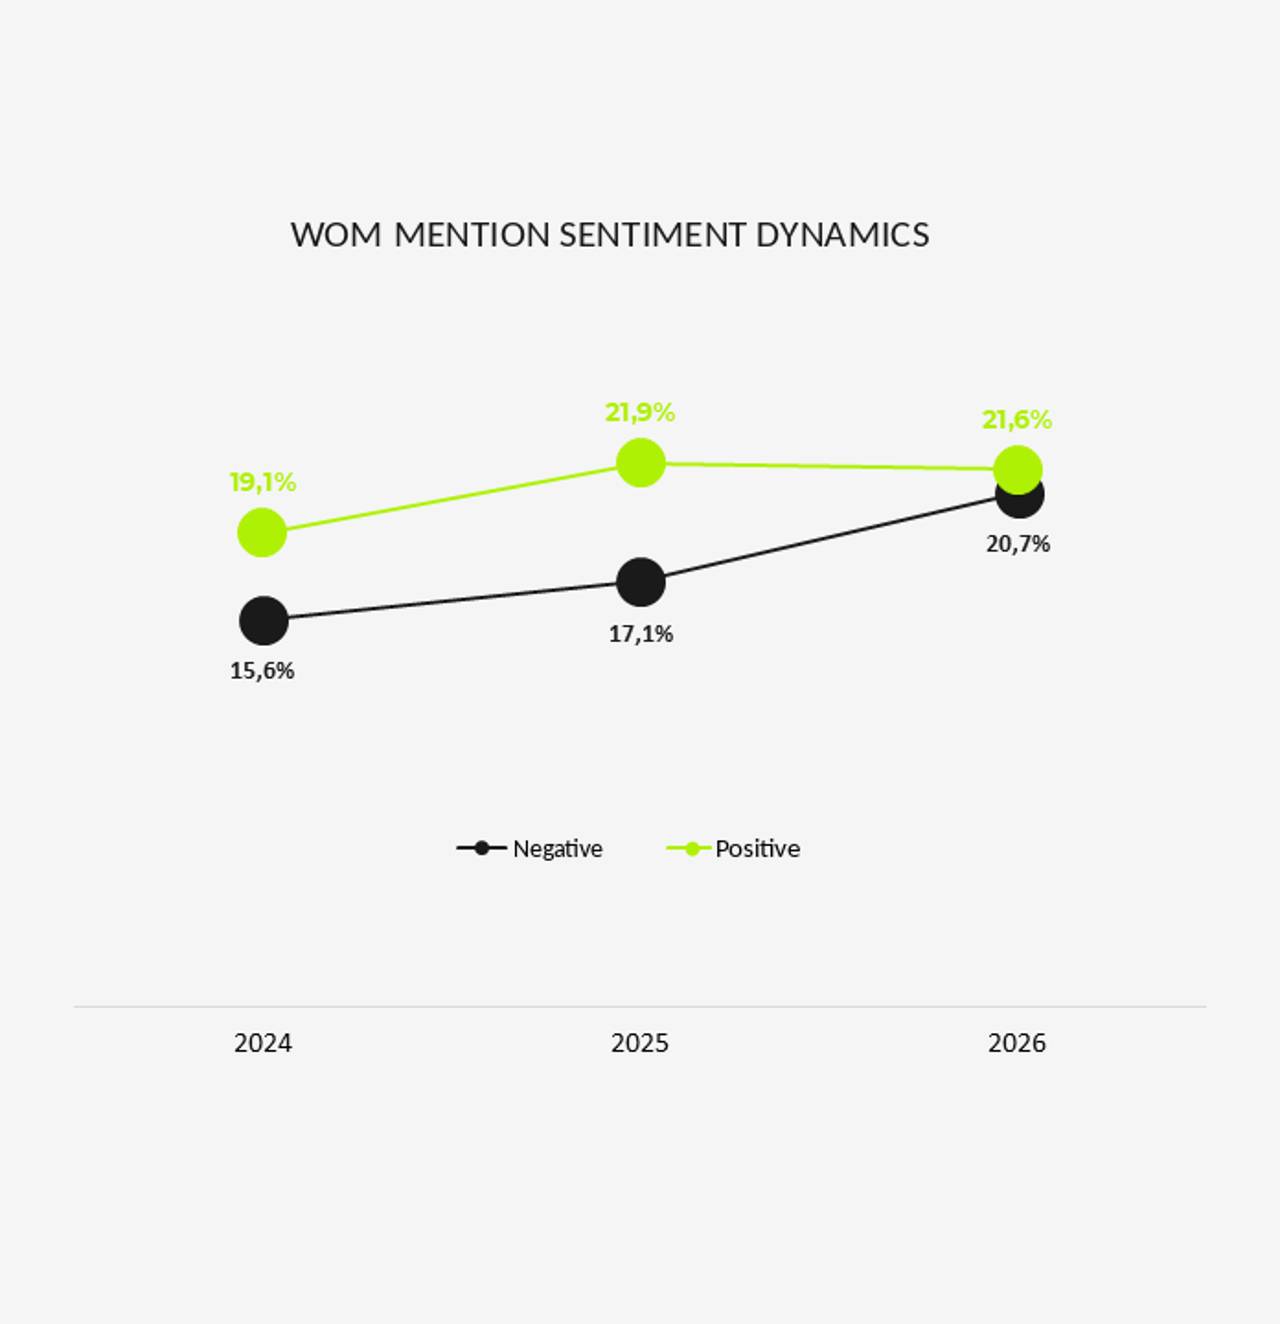
Sentiment: negative mentions rose from 15.6% (2024) to 20.7% (Q1 2026); positive held at 21.6%.
SMM and influencer marketing: three years of growing investment
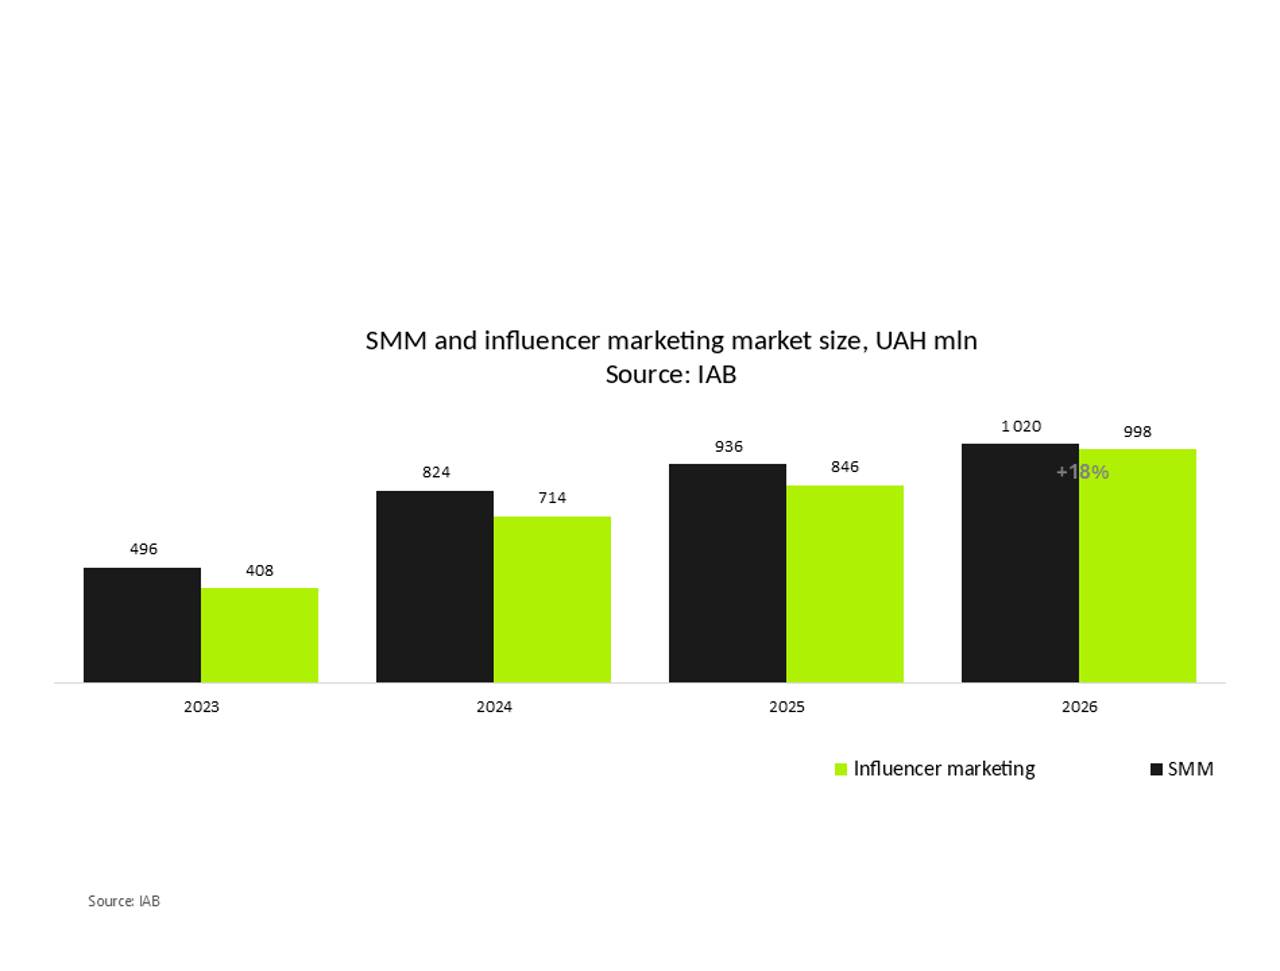
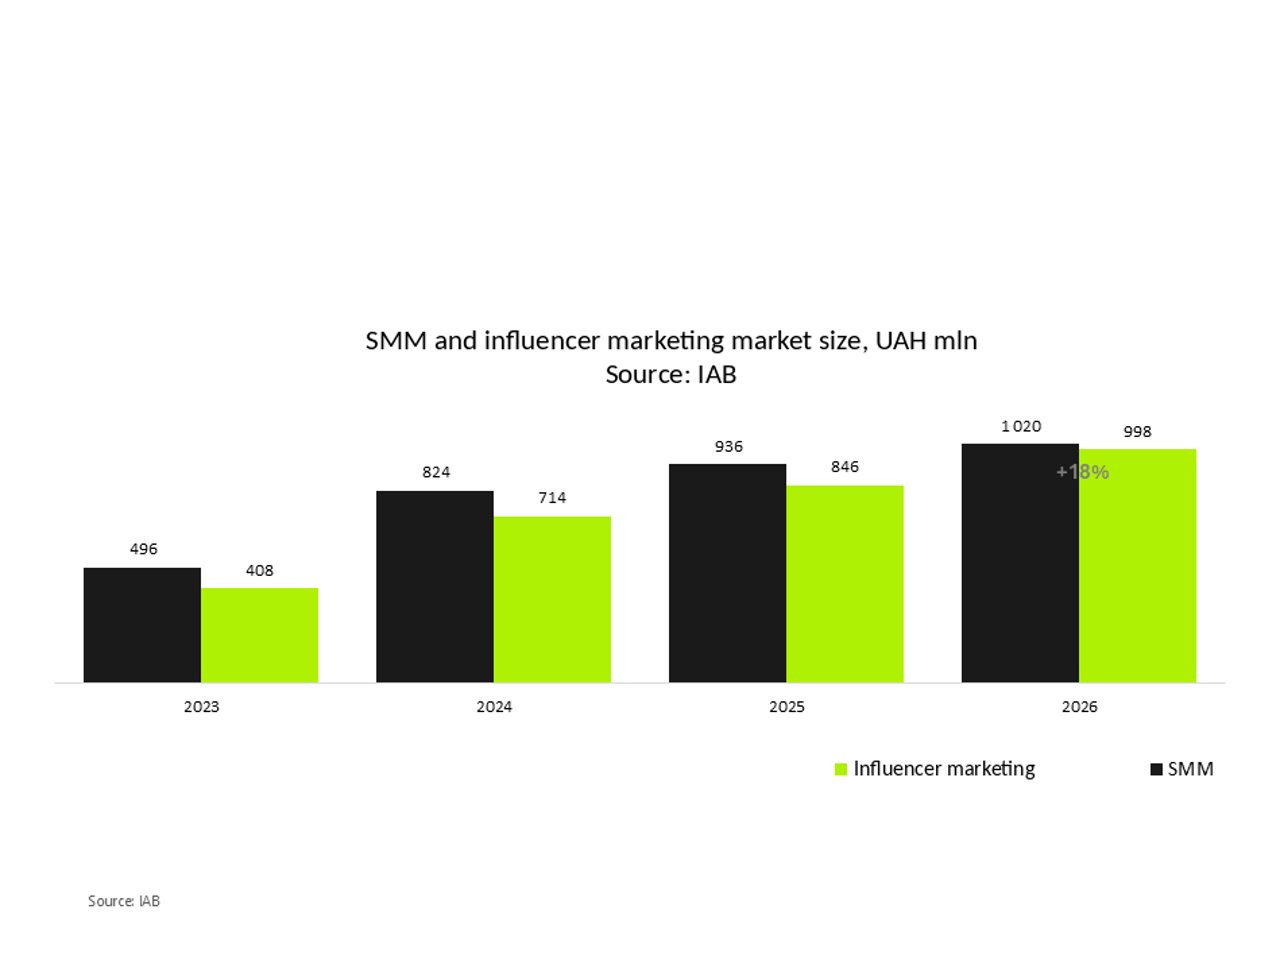
Social media is a confidently scaling segment. According to IAB, Ukrainian brands invested UAH 408 million in SMM and UAH 496 million in influencer marketing in 2023. The trend has stayed strongly positive since then, and investment is forecast to double by 2026 compared with 2023. Brands are actively moving budgets to digital touchpoints where consumers spend most of their time — places where they can not only stay top of mind but actively engage the audience.
Alongside the spend, brands face three systemic questions that practically every client asks their agency:
ROI. How do you measure social media's contribution to business results — sales, loyalty and brand awareness?
Creative. Which content really works, and which goes unnoticed despite the production investment? And how much does creative matter overall?
Fit. Which platforms, volumes and formats make sense for our category?
Without market benchmarks, it's almost impossible to answer these questions objectively. So we set out to build a systematic snapshot, starting with the social media KPIs that social listening captures.
Working with social listening data comes with three structural barriers that have kept market standards from emerging:
Unstructured data. Social media mentions are "raw" content: texts, videos, comments, reactions, stickers. Standardizing them across platforms is harder than with classic media impressions.
Volume. The grocery retail category alone generates 1.8 million mentions a year. Arrays this large can't be handled manually — you need tools for automated monitoring and classification.
Measurement complexity. A direct "mention → purchase" correlation is rare. Brands have to rely on proxy metrics — word of mouth (WOM), engagement rate (ER), and sentiment. That's exactly why benchmarks for these metrics are critical.
How millions of mentions become social listening data and insights
The data for this study was collected and analyzed with YouScan, a platform for monitoring mentions across social networks and online media. Before moving to the results, it's worth looking at how a dataset of this size is turned into a structure that can be compared and benchmarked.
Social media mentions are noisy: commercial posts, irrelevant comments, and spam clutter the dataset, and not every mention is useful for analysis. That's why automatic categorization matters. YouScan flags commercial mentions, promotional and advertising posts, spam, and posts unrelated to the search query — and, conversely, isolates what is relevant for brands. Above all, that means WOM: user mentions, reviews, recommendations, and comparisons — everything about brands, products, and services published by real users.
Today, an online mention can't be reduced to text alone. More and more often, brands appear in content visually, with no name in the caption: a product photo on a store shelf, an unboxing on camera, a video review. Or the mention is only spoken in the audio. Classic text search misses these brand mentions, and they create a blind spot: part of the conversation about the brand goes unnoticed. Image, video, and audio analysis brings this content back into view — and only then does the picture of the category become complete.
For each mention, sentiment, source type, topic, positive and negative attributes, and author information (demographics, even hobbies and interests) are identified automatically. At the scale of millions of mentions, manual coding is physically impossible, so automated classification and tagging come to the rescue.
Finally, there's consistency in how benchmarks are built and measured. A single number means nothing on its own. The answer only appears when a metric is calculated the same way for all categories, platforms, and periods — while accounting for each platform's specifics and for news events that could distort the count without being relevant to the category. This consistency is what turns a set of figures into a benchmark: a shared reference point against which every brand can read its own numbers.
Methodology: 8 industries × 8 platforms × 27 months
Instead of analyzing a single case, we chose the broadest possible scope: 8 categories × 8 platforms × 27 months of data — enough to produce social media benchmarks by industry and by platform.
The study covers eight consumer categories with different buying behavior — from everyday FMCG to high-involvement purchases, from mass retail to niche segments:
Grocery retail
Banks
Cars
Beer
Pet food
Chocolate bars
Energy drinks
Salty snacks
The analysis spans eight key social platforms: TikTok, Threads, Instagram, YouTube, Facebook, Telegram, X (Twitter) and Pinterest. The period runs from January 1, 2024 to March 31, 2026.
Mention volume: stable overall, very different dynamics inside
At the aggregate level, the market shows steady but moderate growth: 4.06 million mentions across the eight categories in 2024 and 4.22 million in 2025 (+4% year over year). In Q1 2026, mention volume grew a modest 0.8% versus Q1 2025 (333.2K vs. 330.5K mentions). But this "average temperature" hides opposite trends within the categories:
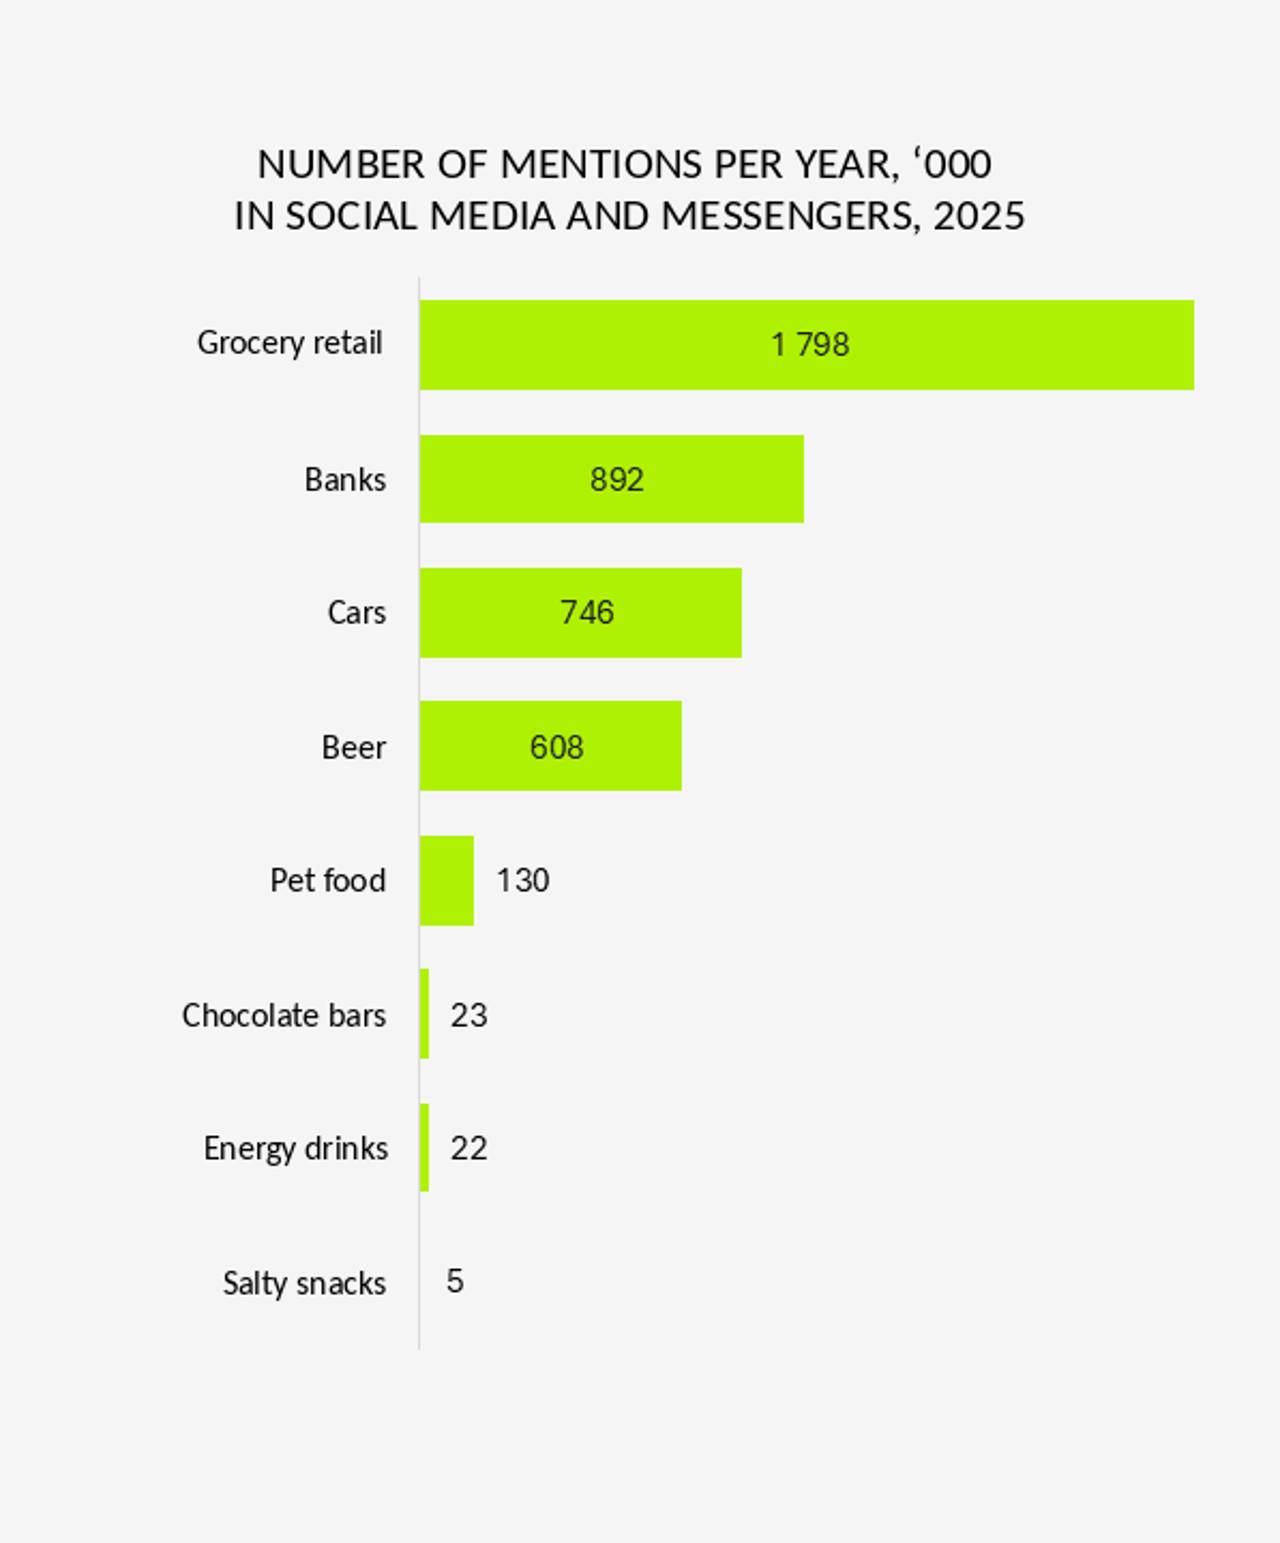
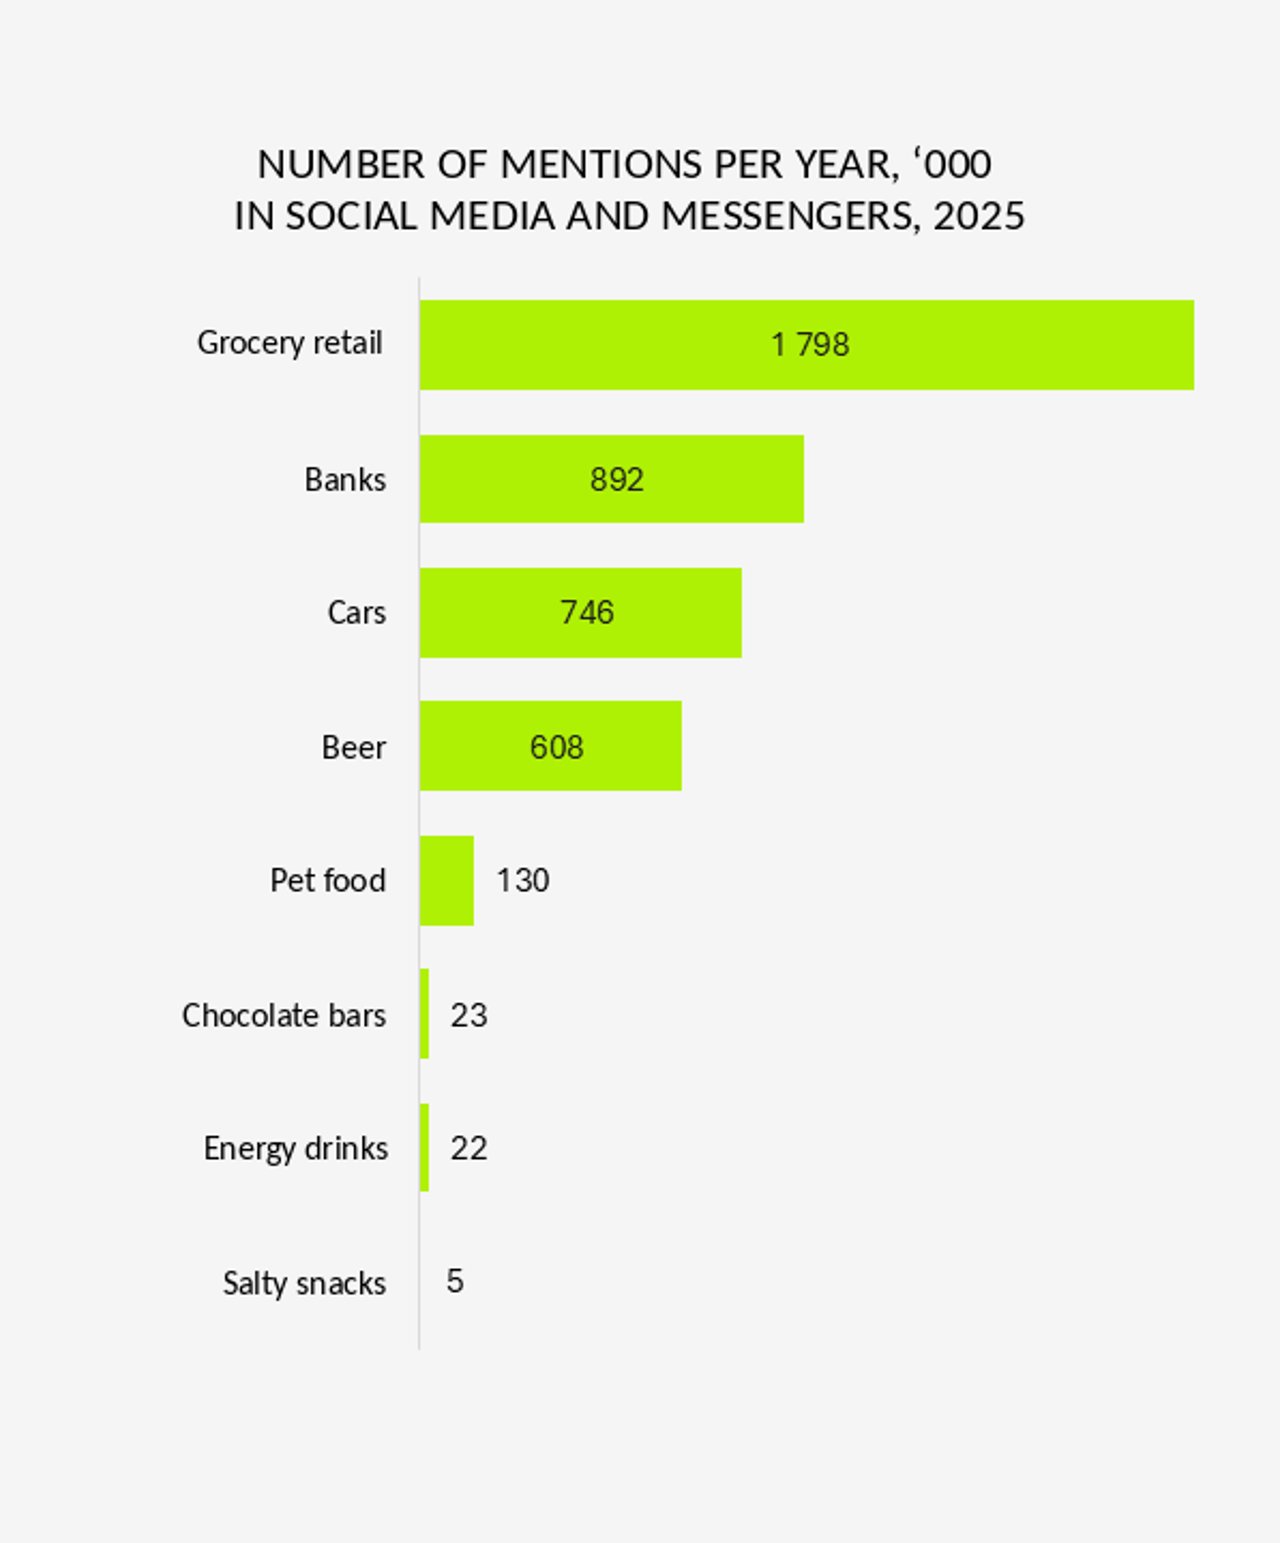
Grocery retail is the most discussed category (1,798K social media mentions in 2025).
Banks took second place with half as many mentions (892K). Note that we deliberately excluded Monobank from this category: its communication approach differs from other banks, and it is heavily mentioned in connection with fundraising campaigns. Including it would have distorted the category picture.
Chocolate bars and energy drinks are discussed far less (23K mentions).
Salty snacks is the least active category analyzed (5K mentions).
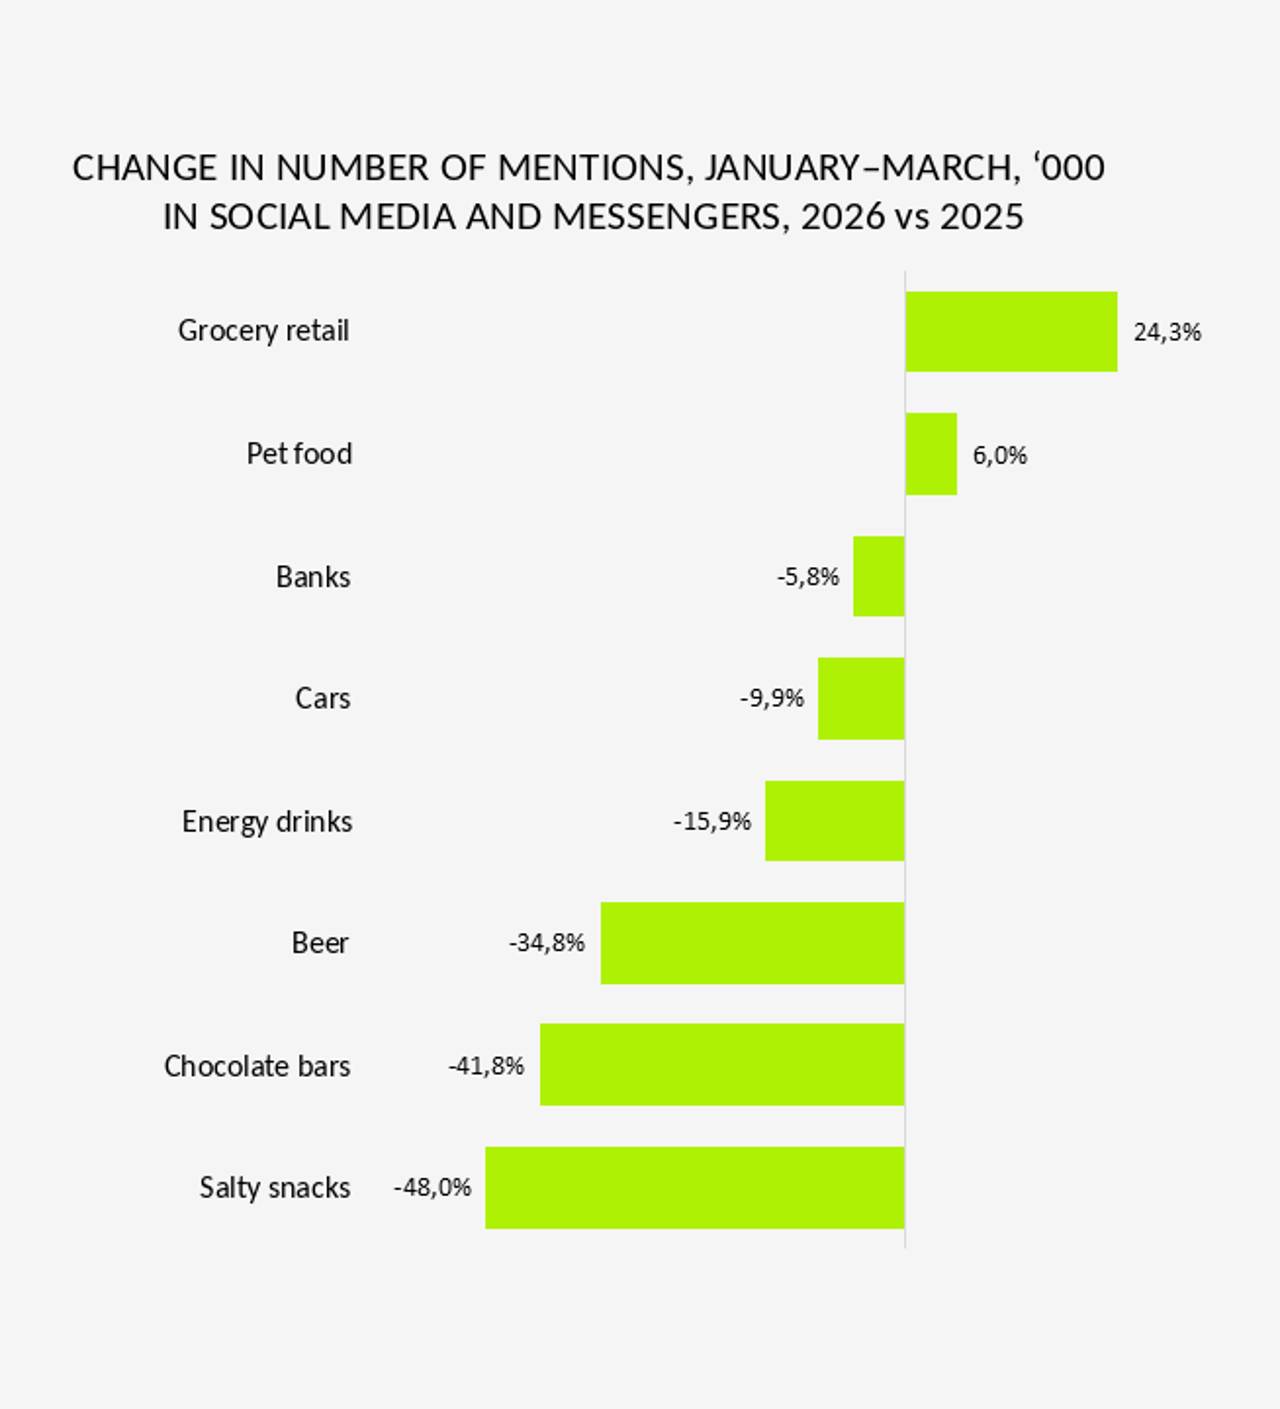
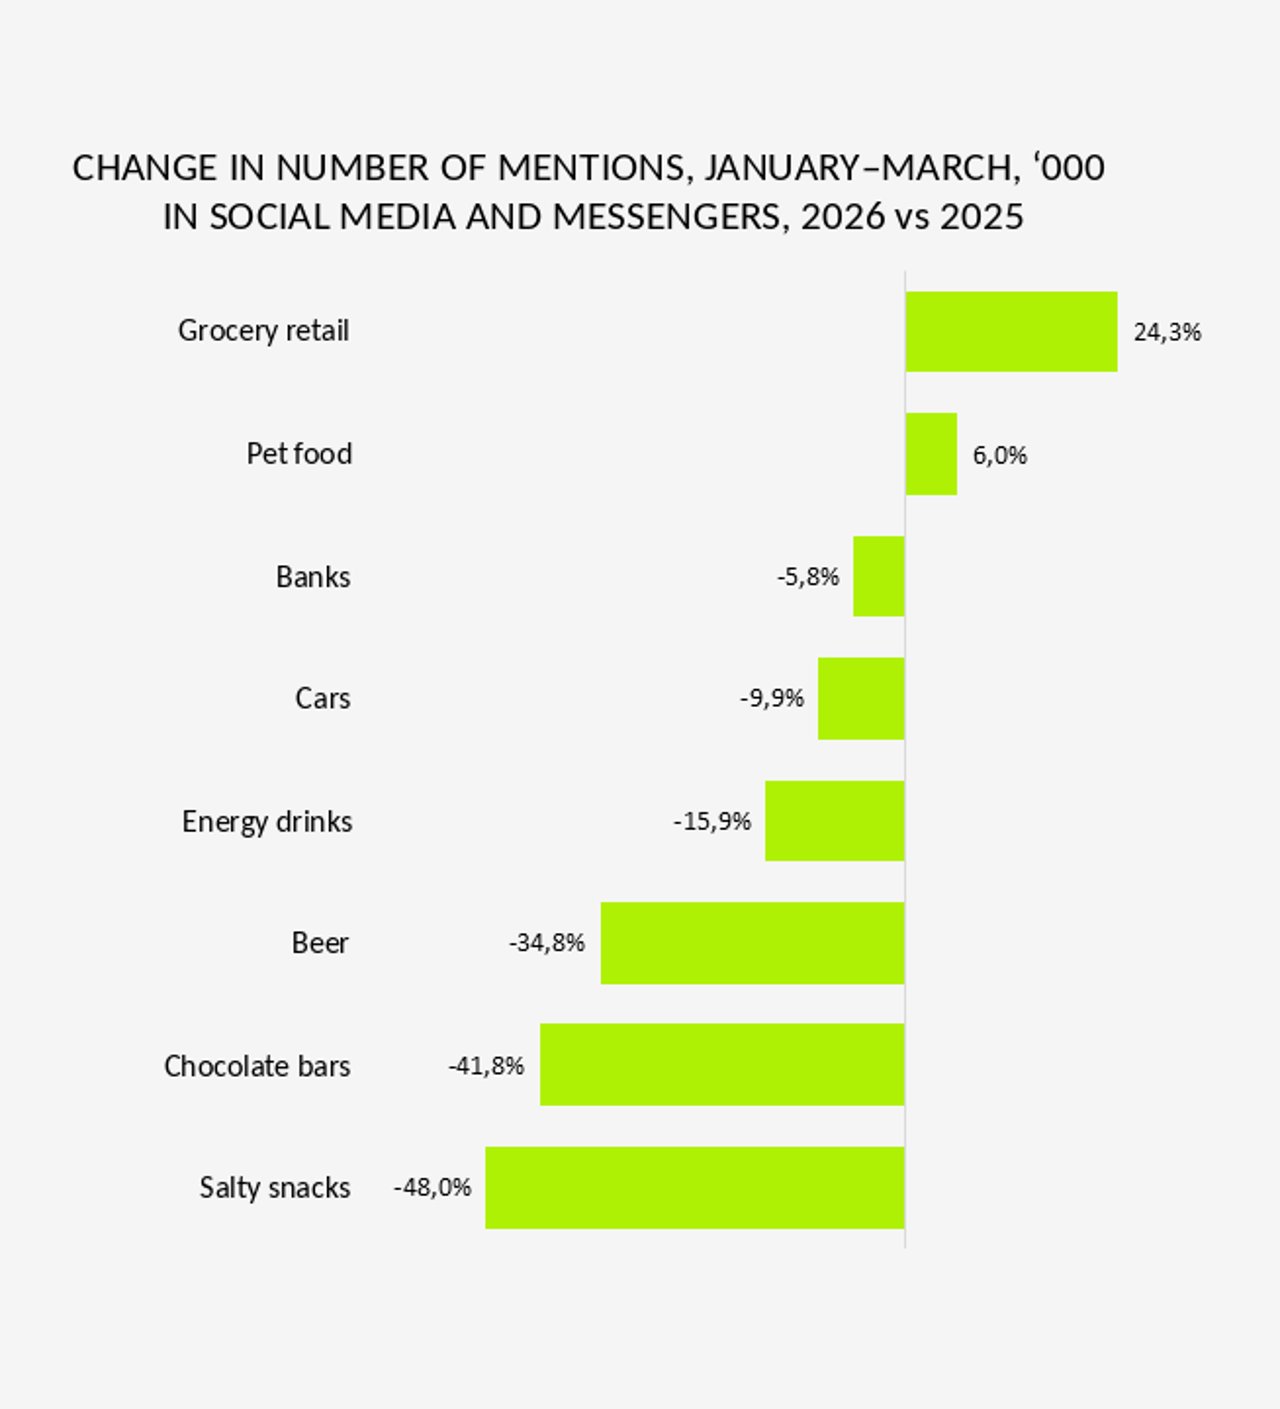
Q1 2026 vs. Q1 2025 dynamics show even sharper divergence:
Grocery retail and pet food are growing in mention volume.
Banks and cars are slightly down compared with 2025.
The remaining categories show a significant decline.
What this means for brands: the category sets the "entry threshold" — the level of activity you need just to be noticed. In growing categories, that threshold rises every year, so under-powered campaigns risk getting lost. In stagnating or declining segments, the opposite is true: even with less activity, there are more opportunities to capture attention.
Word of mouth: the user's voice matters more than the brand's
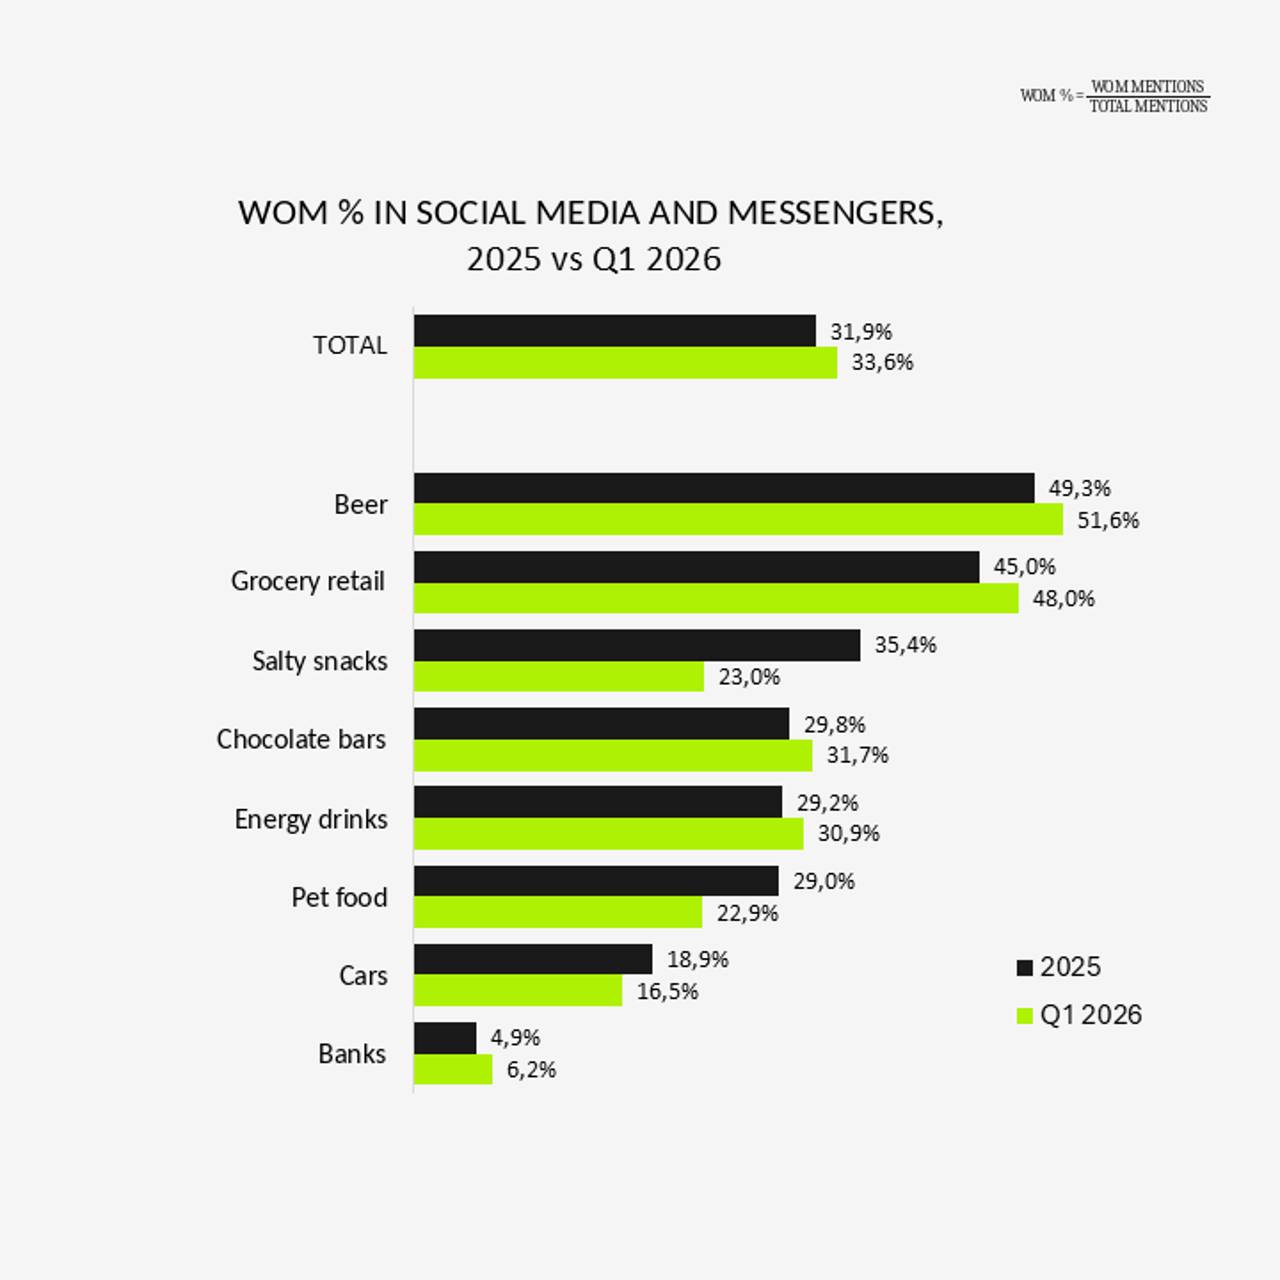
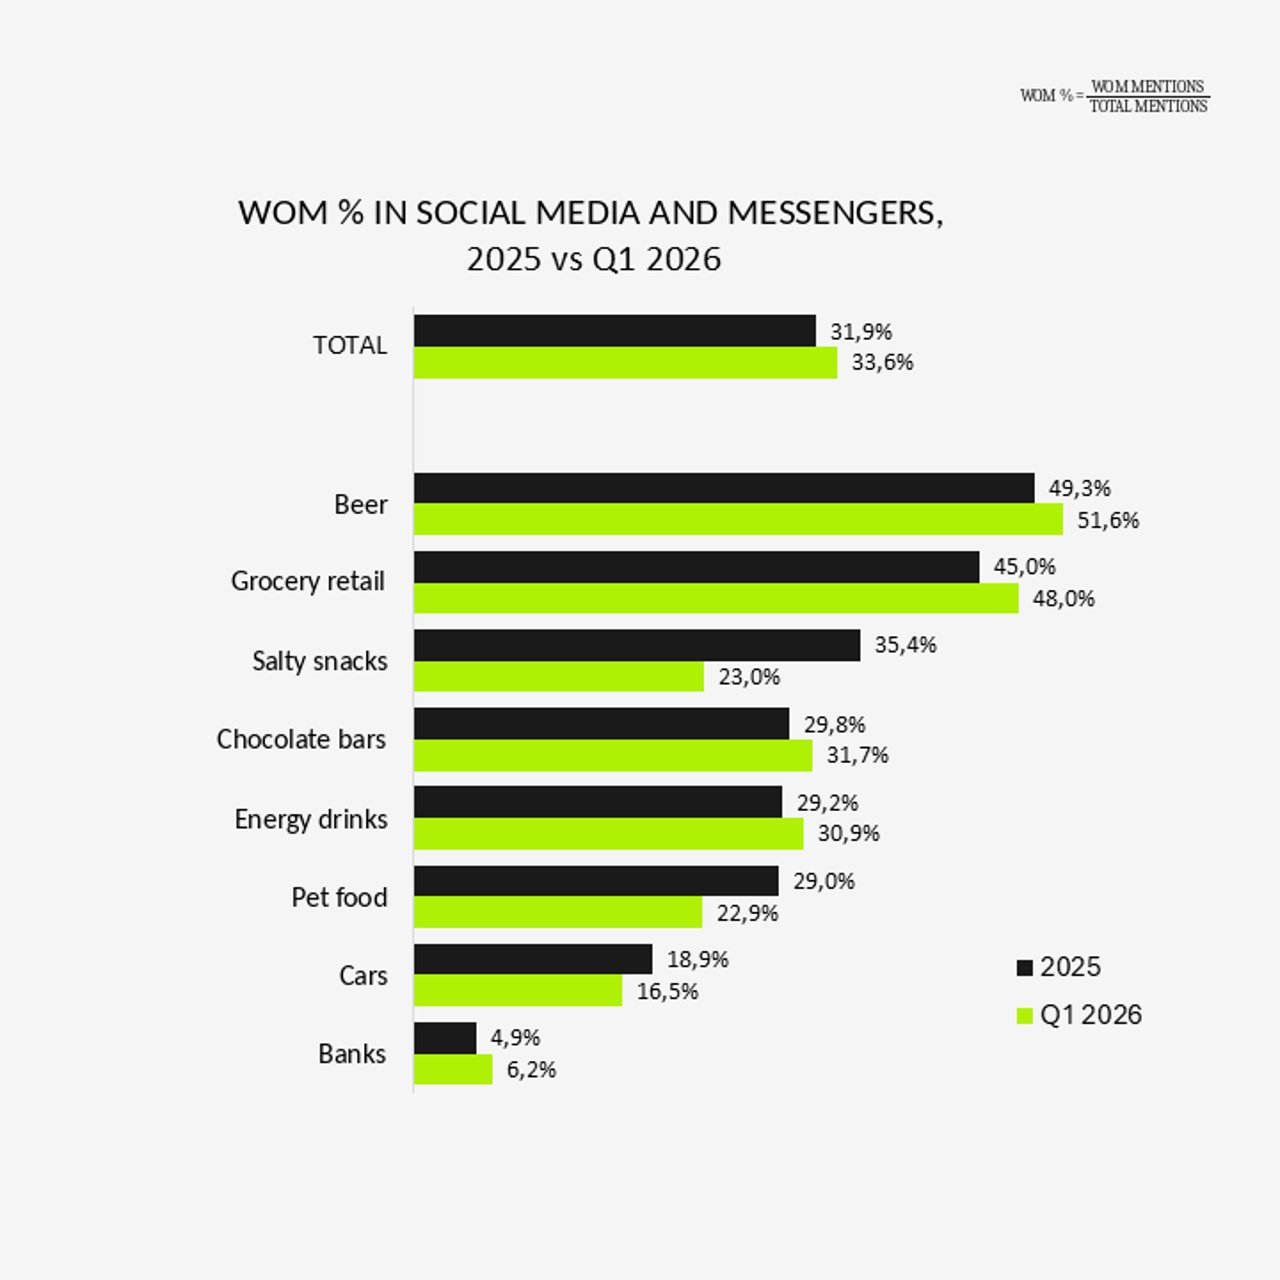
One of the study's key findings: on average, more than a third of all social media mentions are generated by users themselves (WOM) — not by brands or influencers. That's 37.7% in 2024, 31.9% in 2025 and 33.2% in Q1 2026. In other words, a brand that doesn't analyze user-generated content (UGC) is blind to a third of the signals in its category.
The WOM share also varies widely by industry, since categories drive different levels of user activity:
Beer has the largest and most stable UGC share (49.3% in 2025 and 51.6% in Q1 2026).
Grocery retail has almost the same WOM share (45.0% in 2025), and in early 2026 recovered to its 2024 level (48%).
Salty snacks have lost share of conversation for the second year in a row, dropping from 35.4% in 2025 to 23.0% in Q1 2026.
Chocolate bars grow steadily year over year; in Q1 2026, almost one-third of their mentions are UGC.
Energy drinks led on WOM share in 2024 (~70%) thanks to active promotions and a collaboration with S.T.A.L.K.E.R. After a dip in 2025, the category is gradually regaining WOM share.
Banks have the lowest WOM share — just 4.9% in 2025 and 6.2% in Q1 2026 (excluding Monobank).
For brands, the signal is clear: if your brand ER is significantly below your category's WOM ER, you're losing the fight for attention.
These results also confirm that:
Working with micro-influencers can deliver higher engagement than branded content or partnerships with big creators.
UGC should be a source of insight and inspiration for making brand communication more engaging.
Engagement rate: engagement is growing, but unevenly
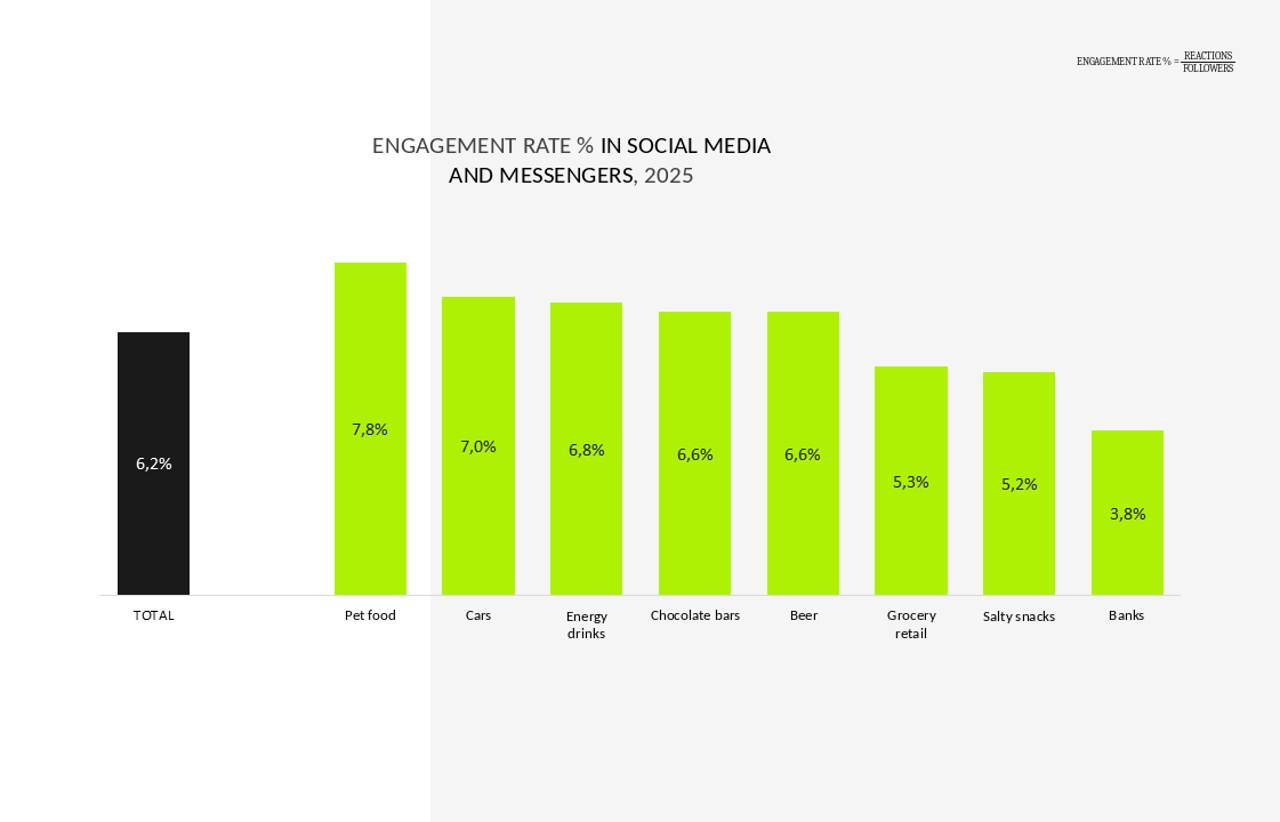
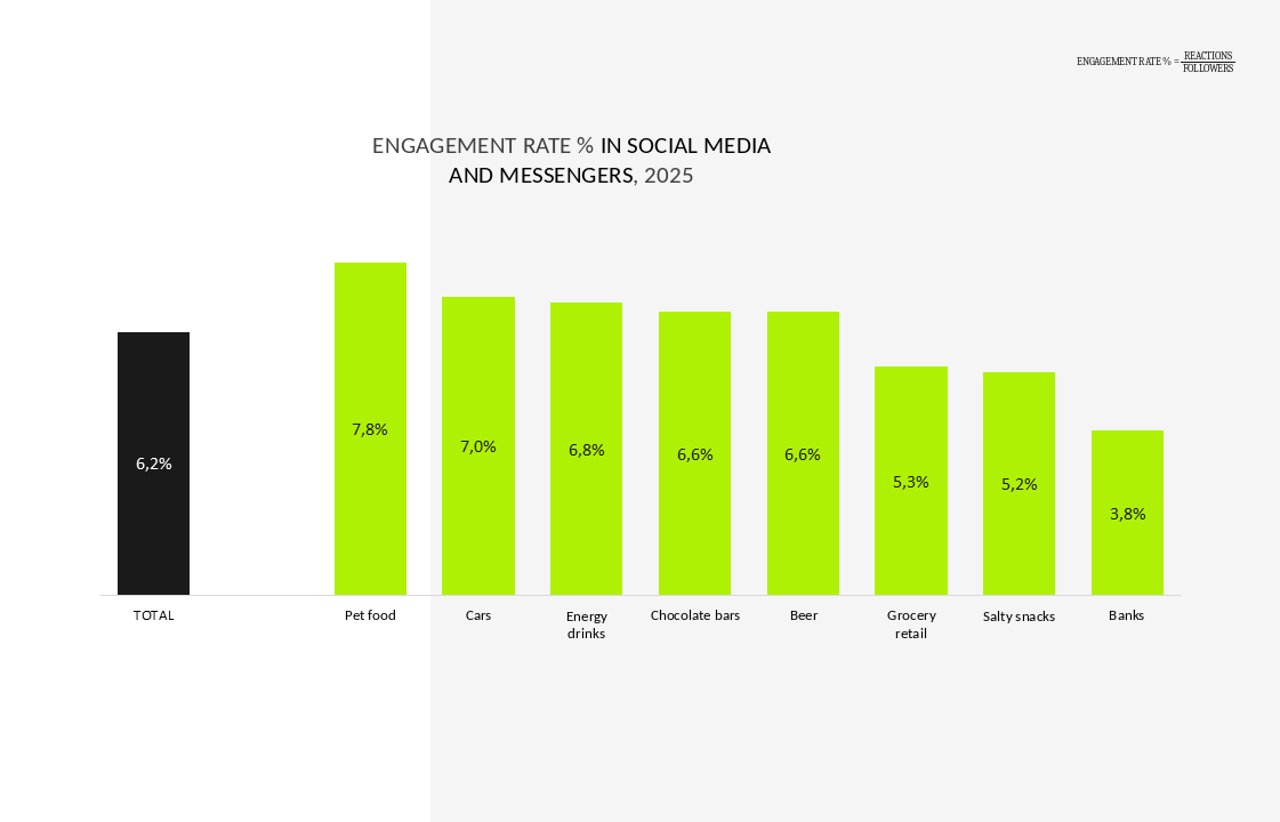
The average engagement rate (the ratio of likes, shares and comments to the number of followers) across the eight categories is also growing year over year. In 2024, Total ER was 5.2% and WOM ER was 6.7%. In 2025, these figures reached 6.2% and 6.9% respectively. A universal pattern emerges: user-generated content gets more engagement than branded content. This is confirmed in 7 of 8 categories.
ER by category in 2025 (total):
Pet food is the category with the highest engagement (7.8%). This is entirely natural for an emotional category that often uses images of animals in its communication. After all, animals and children evoke the strongest positive response.
Cars — 7.0%.
Energy drinks — 6.8%.
Chocolate bars — 6.6%. This is the category with the largest gap between UGC engagement and engagement on branded content.
Beer — also 6.6%. Although this is the most discussed category, its conversion into reactions is only average.
Grocery retail shows a similar pattern: despite high levels of discussion, its ER is even below average (5.3%).
Salty snacks rose to 5.2% from 3.3% in 2024. Promo activations geared toward generating standard, basic UGC work well for the number of mentions, but not for emotional response to such content.
Banks have the lowest ER (3.8%). The explanation is simple: bank communication is perceived primarily as an expert source of information (exchange rates, products, security), so it doesn't trigger a strong emotional response. At the same time, banks are the only category in which users react to official posts the same way as to UGC (ER on branded and user content is practically the same).
For brands, this is a clear signal: if your brand ER is significantly lower than your category's WOM ER, you are losing the fight for attention.
These results also confirm that:
Collaborating with micro-influencers can deliver a higher level of engagement than branded content or partnerships with major bloggers.
UGC should be a source of insights and inspiration for increasing audience engagement with brand communication.
Engagement rate by platform: TikTok and Threads win, Telegram and Pinterest lose
The split of activity between platforms changes faster than any other metric. ER dynamics by platform (2024 to 2025) confirm the global shift toward video formats and microblogging:
TikTok (+5.6 pp) and Threads (+2.4 pp) show the strongest growth. These networks have the highest ER overall, and their growing share of activity is one of the factors behind the overall ER improvement across the categories analyzed.
Instagram, YouTube and X (Twitter) remain stable. Facebook's ER is also almost unchanged, with a slight increase.
Telegram, by contrast, saw its ER fall by almost half.
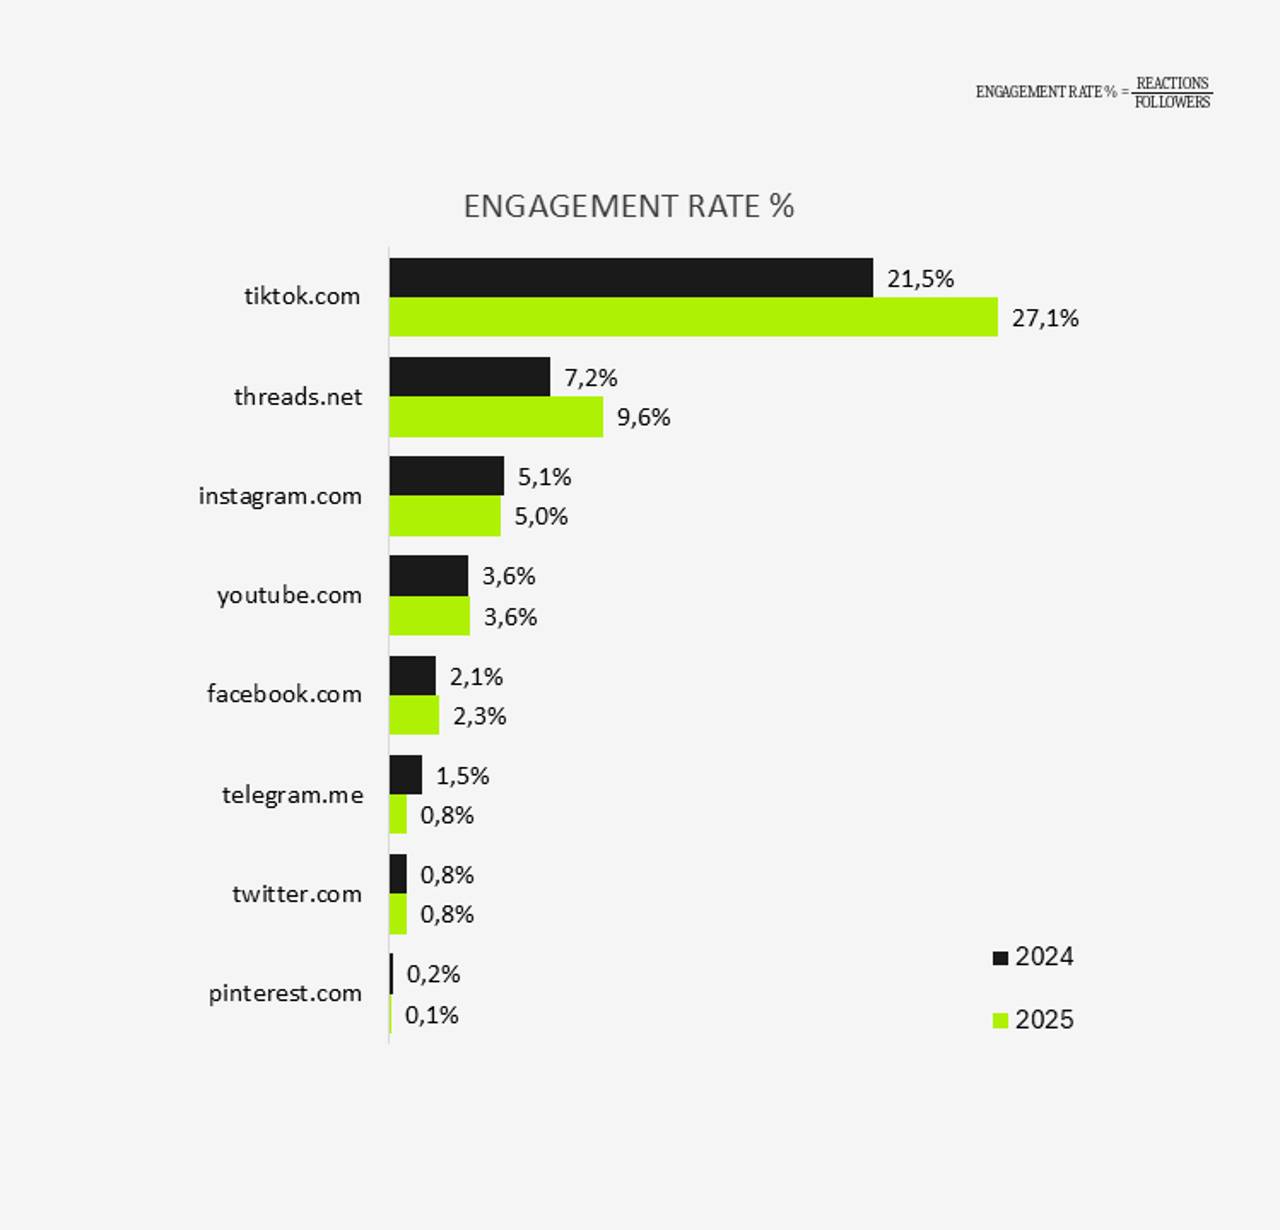
For brands, this means rethinking the platform split: being "a little bit everywhere" no longer pays off. A media strategy should consider not just reach but each platform's ability to generate meaningful reactions to a specific type of content. We also saw ER on each platform vary by category, so look beyond overall figures and consider how well a platform fits your audience and content.
Social media sentiment: negativity is rising, but positive still leads
One of the most worrying trends in the study is the gradual rise in negative mentions: 15.6% in 2024 → 17.7% in 2025 → 20.7% in Q1 2026. At the same time, positive sentiment remains high: 19.1% → 21.9% → 21.6%. Audiences are becoming more emotional in both directions, while the share of neutral mentions shrinks.
Ukrainians are becoming more sensitive under constant stress.
Content that triggers an emotional reaction wins in the media space.
In Q1 2026, sentiment is unevenly distributed across platforms:
X (Twitter) remains the "hate platform" (25.1% negative).
Threads ranks second for negativity (22.4%) but also shows a growing share of positive mentions (27.6%). This supports its positioning as the most open, honest and transparent platform for conversation — and therefore one of the most emotionally expressive.
Instagram and TikTok remain predominantly positive. Instagram has the largest positive share (46%). TikTok shows confident growth (from 18.7% in 2025 to 28.5% in Q1 2026). No surprise, then, that these two networks often "rescue" Ukrainians and take up an ever-larger share of their media consumption.
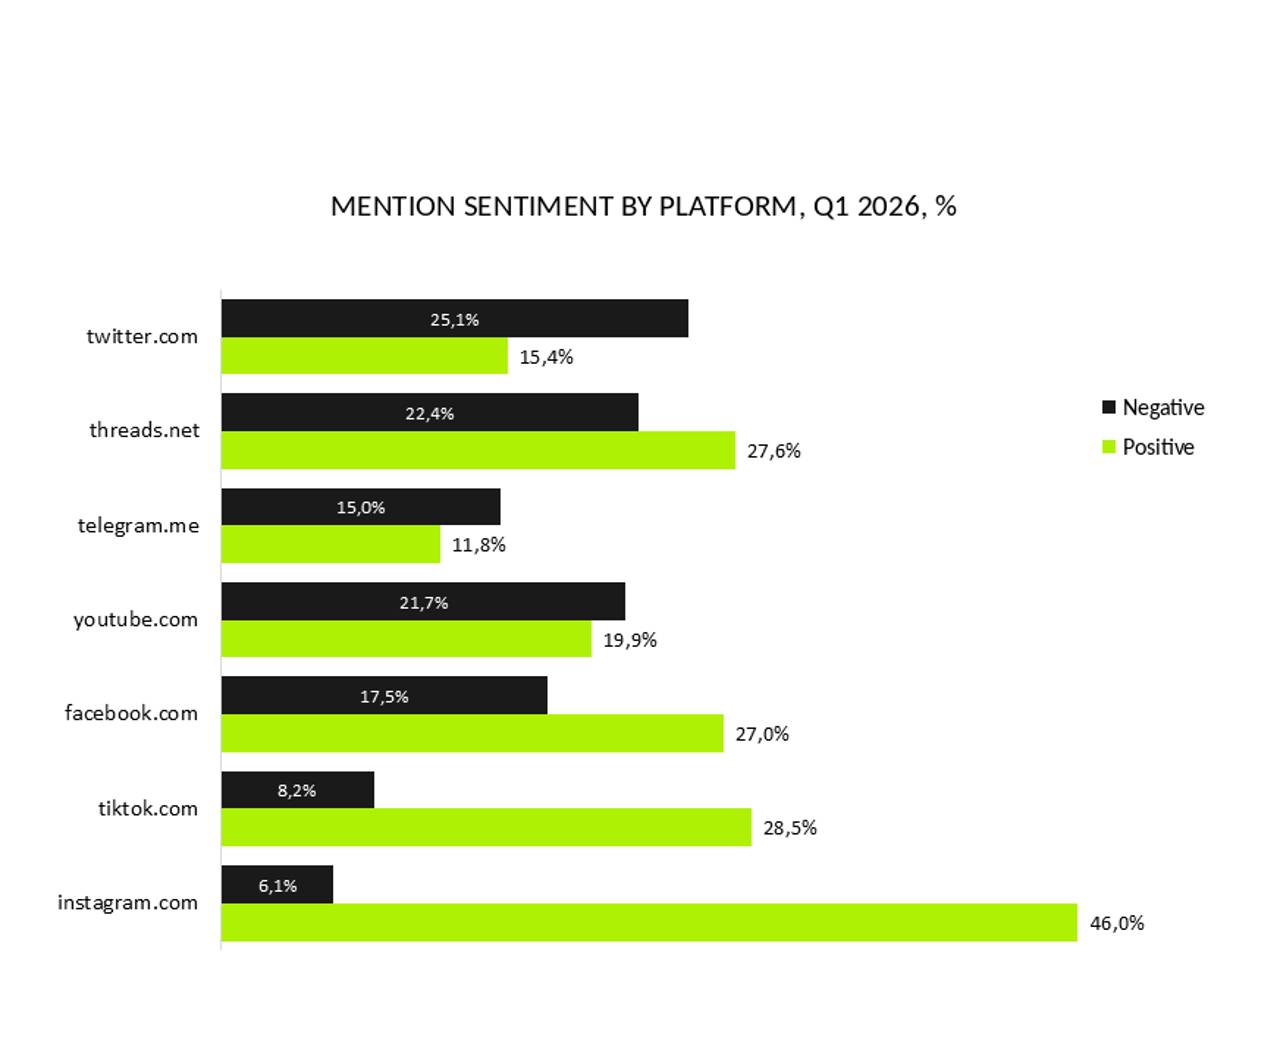
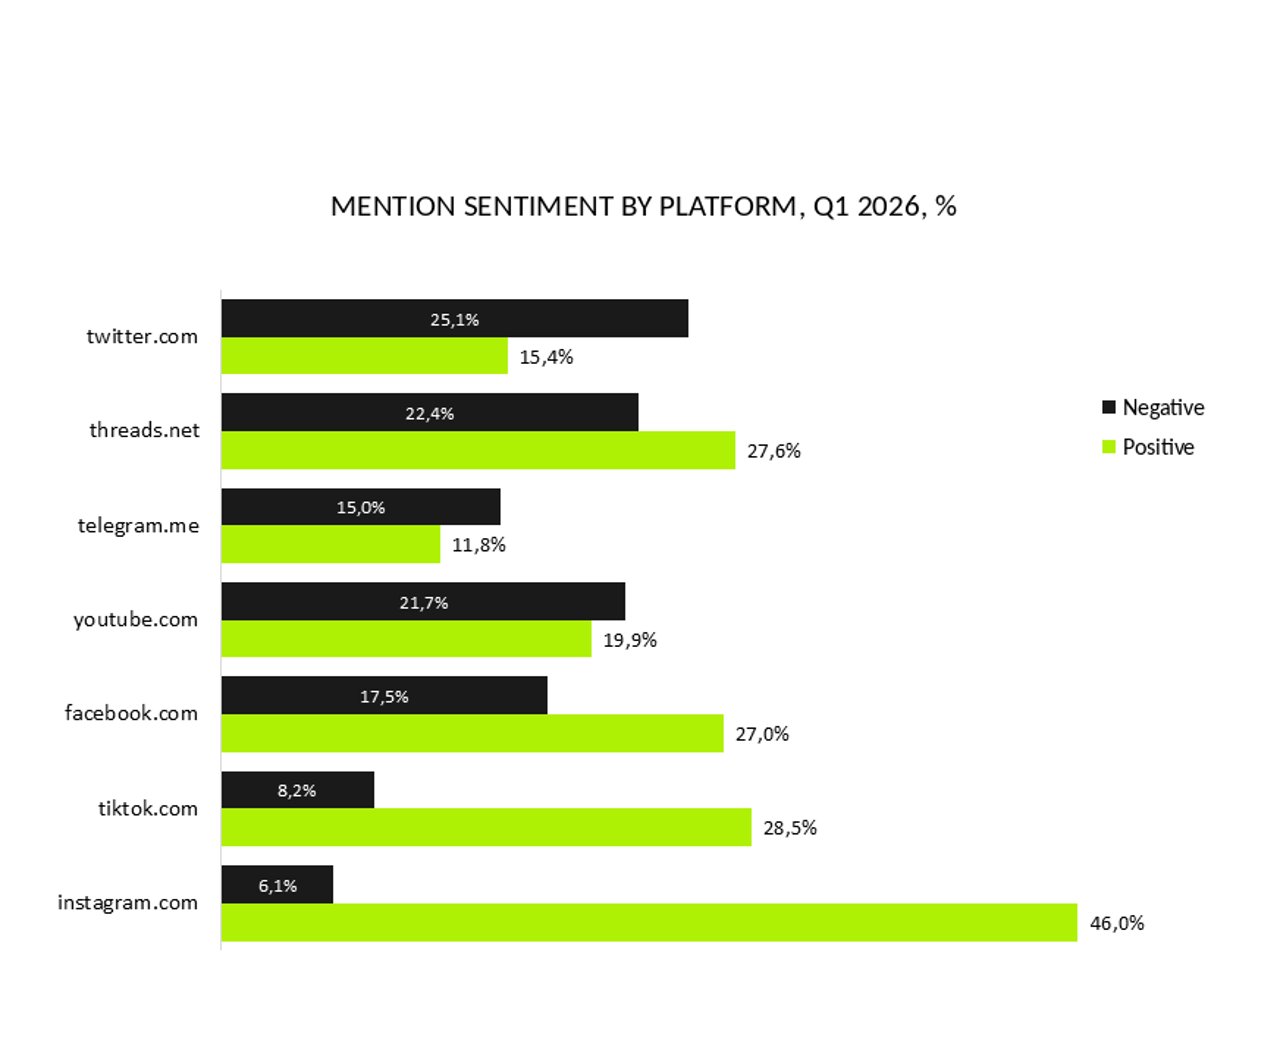
The practical takeaway: brand sentiment analysis should be platform-specific. The same news event can trigger diametrically opposite reactions on Facebook and TikTok.
4 key insights for brands
1. Category activity sets the "entry threshold"
Before setting goals for mention volume or ER, compare your numbers with your category benchmarks. In growing categories, you need to raise your communication "ceiling" every year, or you'll steadily lose share of voice. In stagnating or declining segments, by contrast, there's a window for fast share of voice (SOV) growth.
2. Brand campaigns visibly drive activity and engagement
Peaks in a brand's social media activity clearly coincide with active campaign periods. Social listening data can serve as a fast, tactical barometer of creative and brand-action effectiveness — alongside classic post-buy analysis.
3. UGC engages more, but it depends on the category
In 7 of 8 categories, WOM ER is higher than brand ER. That's a strong argument for investing in user-generated content, referral programs and influencer collaborations, where the user's voice is the key driver of engagement. Consumer mentions can also be a source of insight and inspiration for branded content.
4. Platform choice directly affects engagement rate
The engagement rate gap between platforms is substantial: 27.1% on TikTok vs. 0.8% on Telegram and X (Twitter). With the same budgets and creative, engagement results can differ many times over purely because of the platform choice.
Conclusion: social media engagement benchmarks are the new baseline for brand strategy
Our research shows there are no "universally good" numbers in social media. A figure that's strong for banks may be mediocre for pet food — and vice versa. That's why building your own benchmarks — by category, by platform and updated quarterly — should become a core part of planning SMM and influencer strategies. (For the method, see competitive benchmarking.)
At Publicis Groupe Ukraine, we continue to expand this benchmark database together with YouScan and look forward to sharing new results and updates with the market.
The next logical step is integrating social listening data with brand business metrics (sales, brand health tracking, conversion) through marketing mix modeling and custom dashboards. That's when social media metrics will start systematically proving their business value.
Source: YouScan Social Listening; analytics by Publicis Groupe Ukraine Data Science. 8 categories (grocery retail, banks, cars, beer, pet food, chocolate bars, energy drinks, salty snacks), 8 platforms (TikTok, Threads, Instagram, YouTube, Facebook, Telegram, X (Twitter), Pinterest), period 01.01.2024–31.03.2026.
FAQ
1. What are social media engagement benchmarks?
Social media engagement benchmarks are reference values for metrics such as engagement rate, word-of-mouth share and sentiment, calculated the same way across a category, platform and period. They let a brand judge whether its own numbers are strong or weak for its industry.
2. What is a good engagement rate on social media?
It depends on the industry and platform. In this study, the average engagement rate across eight industries was 6.2% in 2025, ranging from 3.8% for banks to 7.8% for pet food. A brand is performing well if its ER is at or above its category's benchmark.
3. What is the average engagement rate by industry?
In 2025: pet food 7.8%, cars 7.0%, energy drinks 6.8%, chocolate bars 6.6%, beer 6.6%, grocery retail 5.3%, salty snacks 5.2% and banks 3.8%.
4. Which social media platform has the highest engagement rate?
TikTok — 27.1%, compared with 0.8% on Telegram and X (Twitter). TikTok (+5.6 pp) and Threads (+2.4 pp) also showed the strongest ER growth from 2024 to 2025.
5. Does user-generated content get more engagement than brand content?
Yes, in 7 of 8 industries studied. Average WOM ER was 6.9% in 2025 vs. 6.2% for all content. Banks are the only category where branded and user content earn practically the same ER.