Updates Digest: Logo Comparison and TikTok Monitoring

We continue improving YouScan all the time, and we have collected some of the most recent updates of our system that can help you listen to your clients and understand them better.
Logo comparison
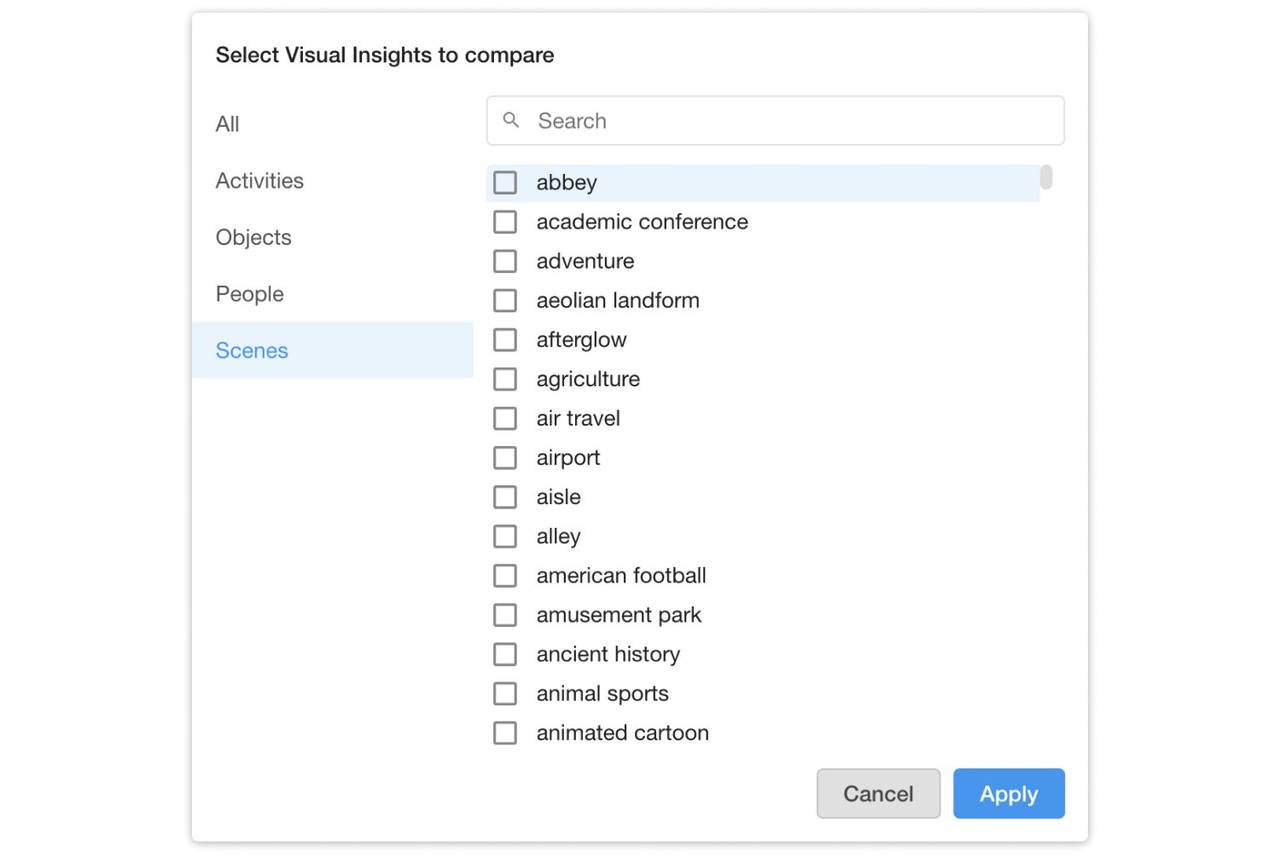
YouScan had already provided the opportunity to analyze activities, objects, people, and scenes present on images simultaneously with logos. However, we have decided to go even further and enhance this feature by adding a new twist to it. You can now explore the aforementioned elements and compare the data to the results of your competitors.
We decided to find out which beer brand out of the chosen three (Corona, Carlsberg, Heineken) appears on photos more often in three certain scenes: apartment, beach, bar.
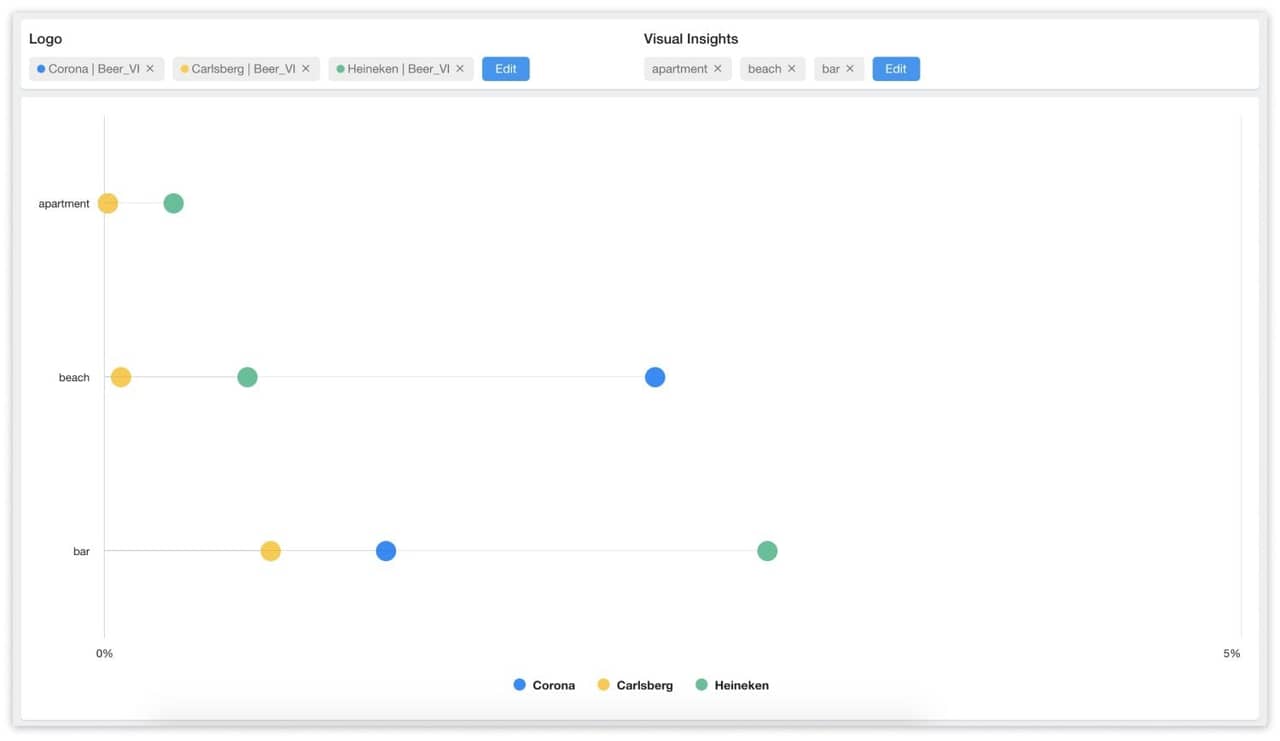

It turned out that people do not show themselves drinking Corona or Carlsberg at home, but they do it with Heineken. On top of that, it is the most popular beer brand on photos taken in bars, whereas Corona is the top choice for beach days.
All in all, this chart enables you to find answers to these important questions in just a few clicks:
- How do consumption situations of your product and its alternatives differ from one another?
- What is the scale of reach that your brand and your competitors achieve after sponsoring the same event or similar ones?
- What are the differences between audiences that consume and use products of different companies?
However, these are just a few examples of use cases, and there is no need to limit yourself by focusing on them. The graph is both universal and multifunctional. Give it a try to find a way that will be the most effective and valuable for your company.
To make this happen, you just need to choose several brands for the analysis and select activities, objects, people, and scenes for the comparison.

TikTok Monitoring
You can argue whether there is any need to monitor this social media platform or you can find out how many mentions of your brand are out there, and there will be neither any questions nor any doubts on the matter.
For example, in the case of Starbucks, not monitoring TikTok means missing over 5,000 mentions every single month. This is a small number compared to other platforms, but it is steadily growing.
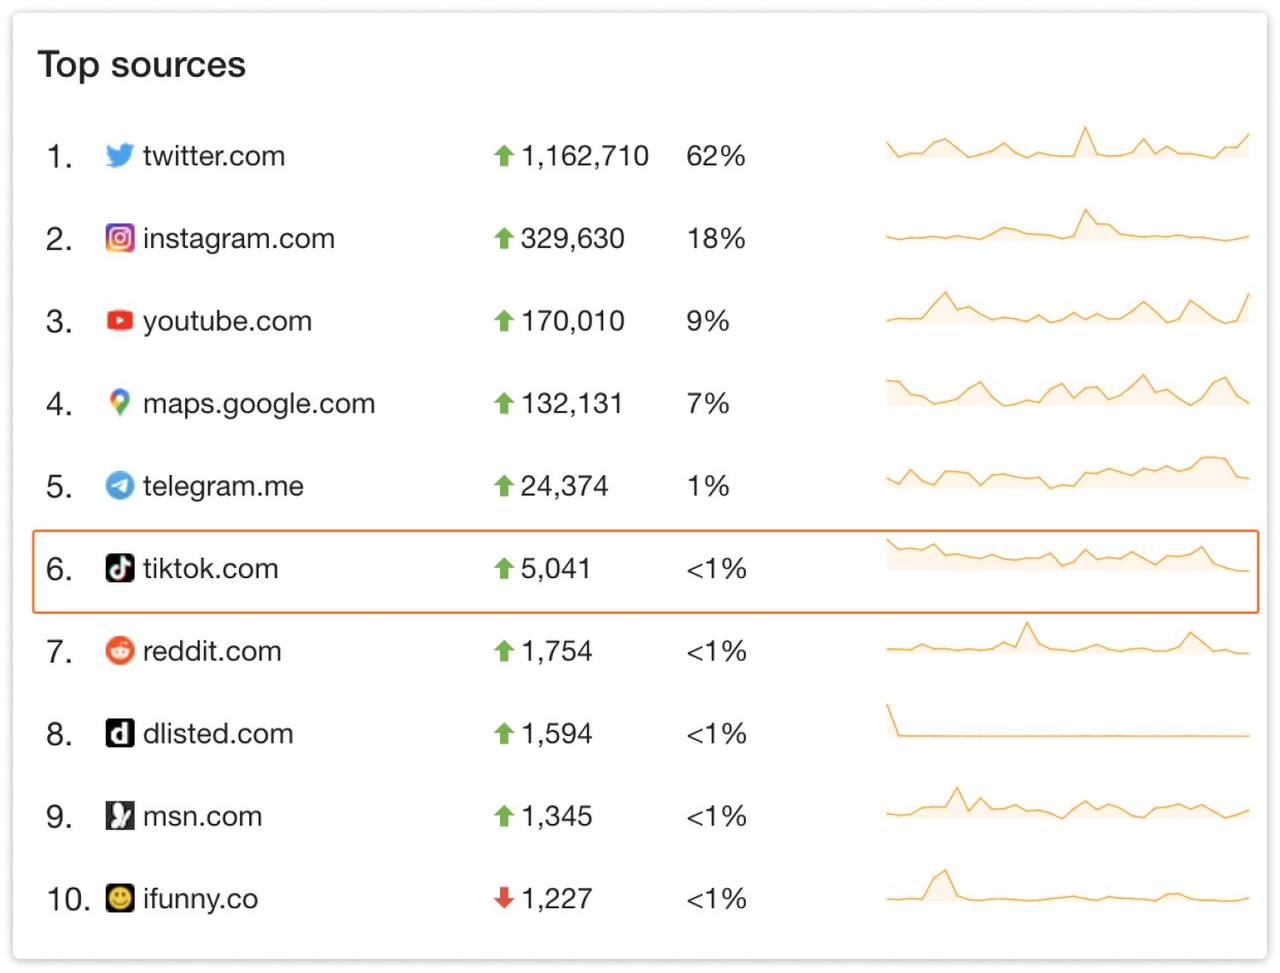

Meanwhile, for a brand like Pepsi, TikTok is currently one of the top sources of mentions which makes its monitoring a priority.
YouScan monitors hundreds of posts from TikTok and analyzes:
thumbnail content;
post descriptions;
trends within a chosen topic.
In order to find out more about monitoring this particular social media platform, please read our recent article about it.
New WOM categories from AINA
Dealing with vast amounts of mentions has just gotten even easier. We have added seven WOM (word-of-mouth) sub-categories: Mismatch, Complaint, Opinion, Question, Official response, Comparison, Recommendation.
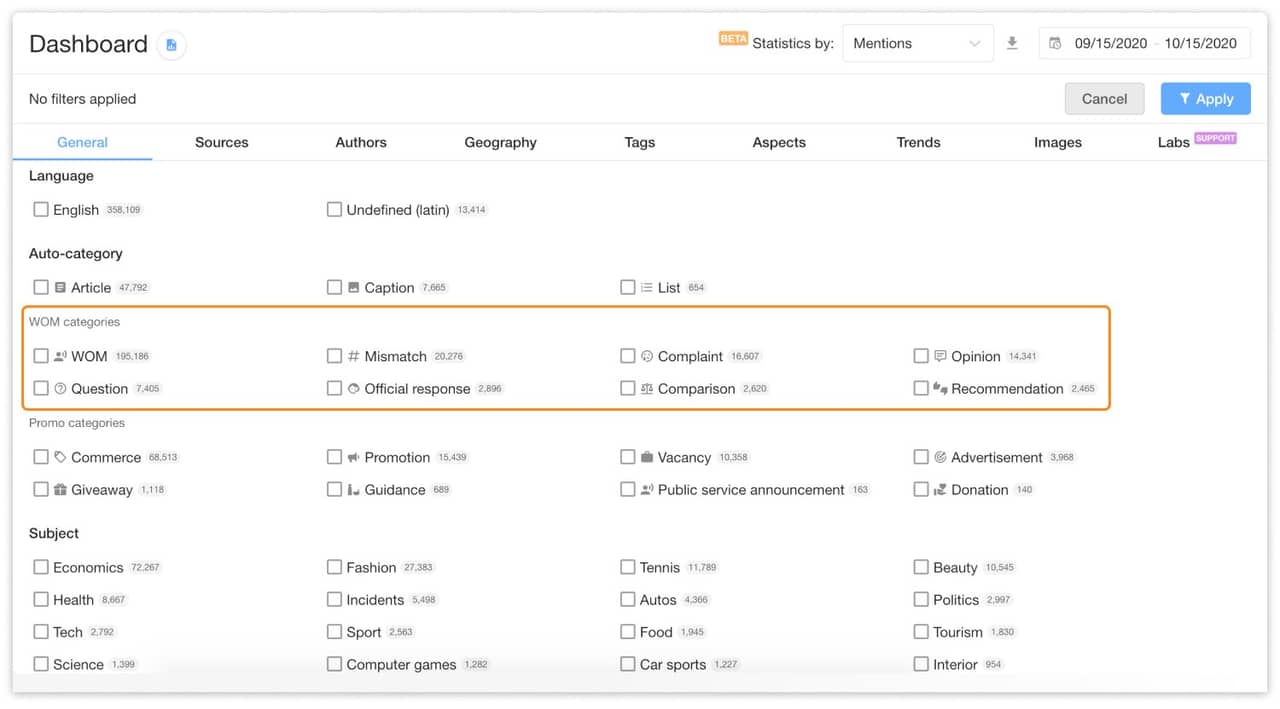

This feature enables you to improve your monitoring process even more. For example, you can get rid of those posts that do not actually related to your brand by turning off the “mismatch” subcategory.
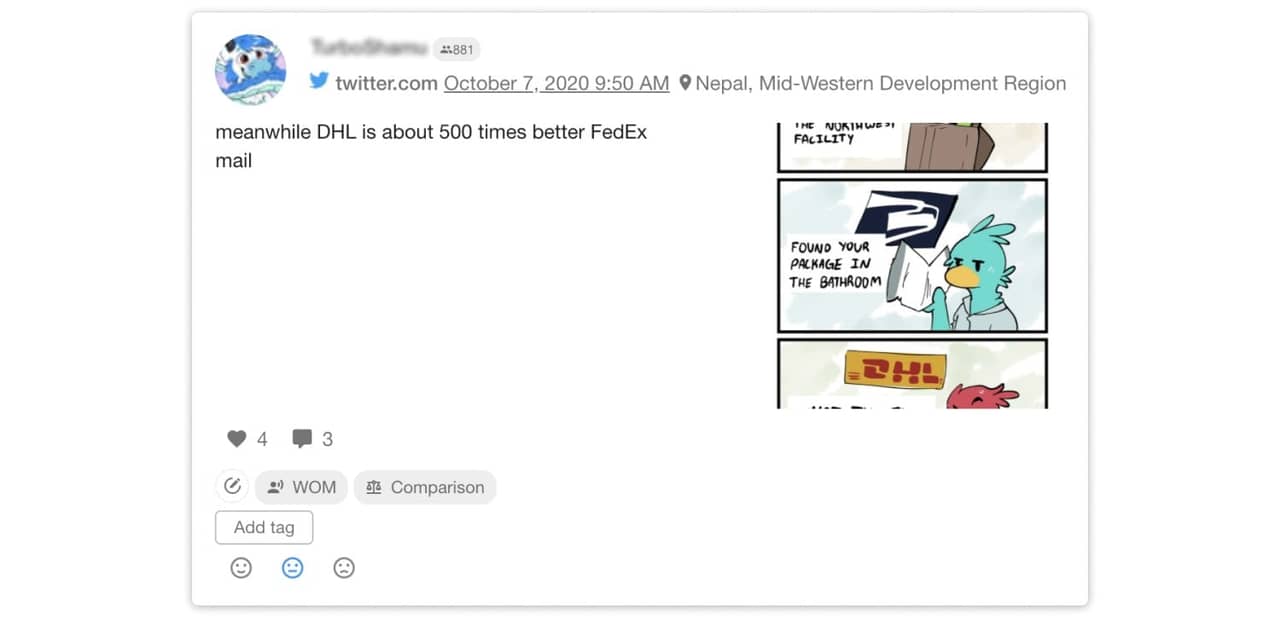
Another way to benefit from this update is to explore how your services or products are compared to your competitors and why.

More ways to sort mentions
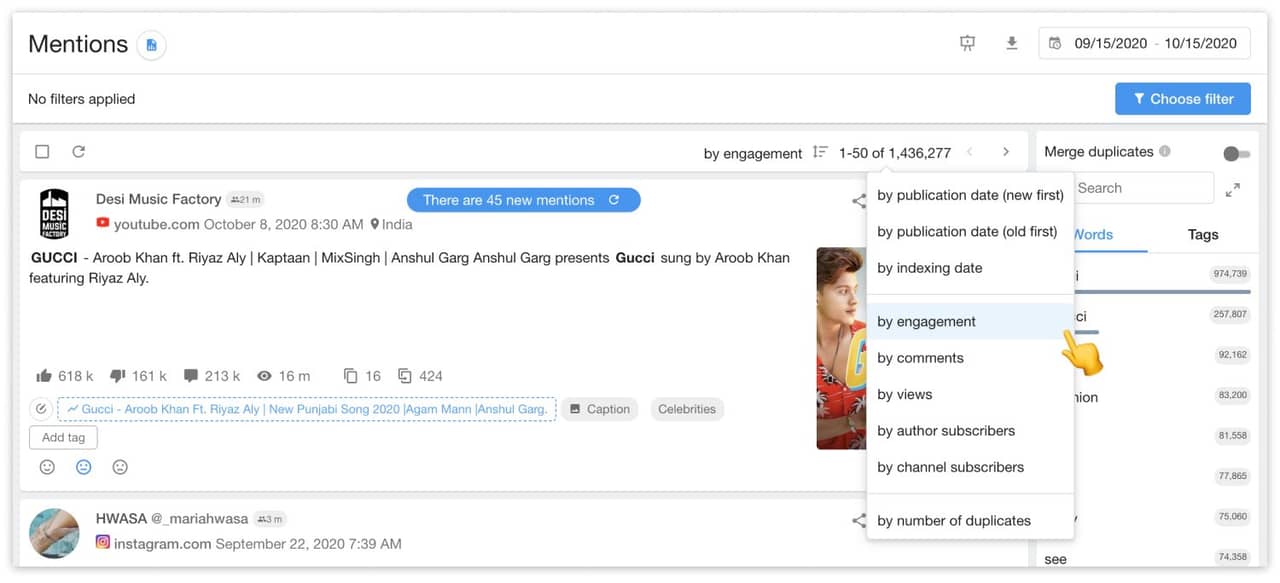
In general, the first mentions that appear in your stream are the most recent ones, but you can make some changes according to your needs. Choosing to sort them by engagement allows you to see the most popular posts about your brand and work with them first. As always, there is a variety of use cases for this feature.

Would you like to find out what people say about your brand online? Request our free demo.

