Visual Insights offer new opportunities for next-level digital marketing
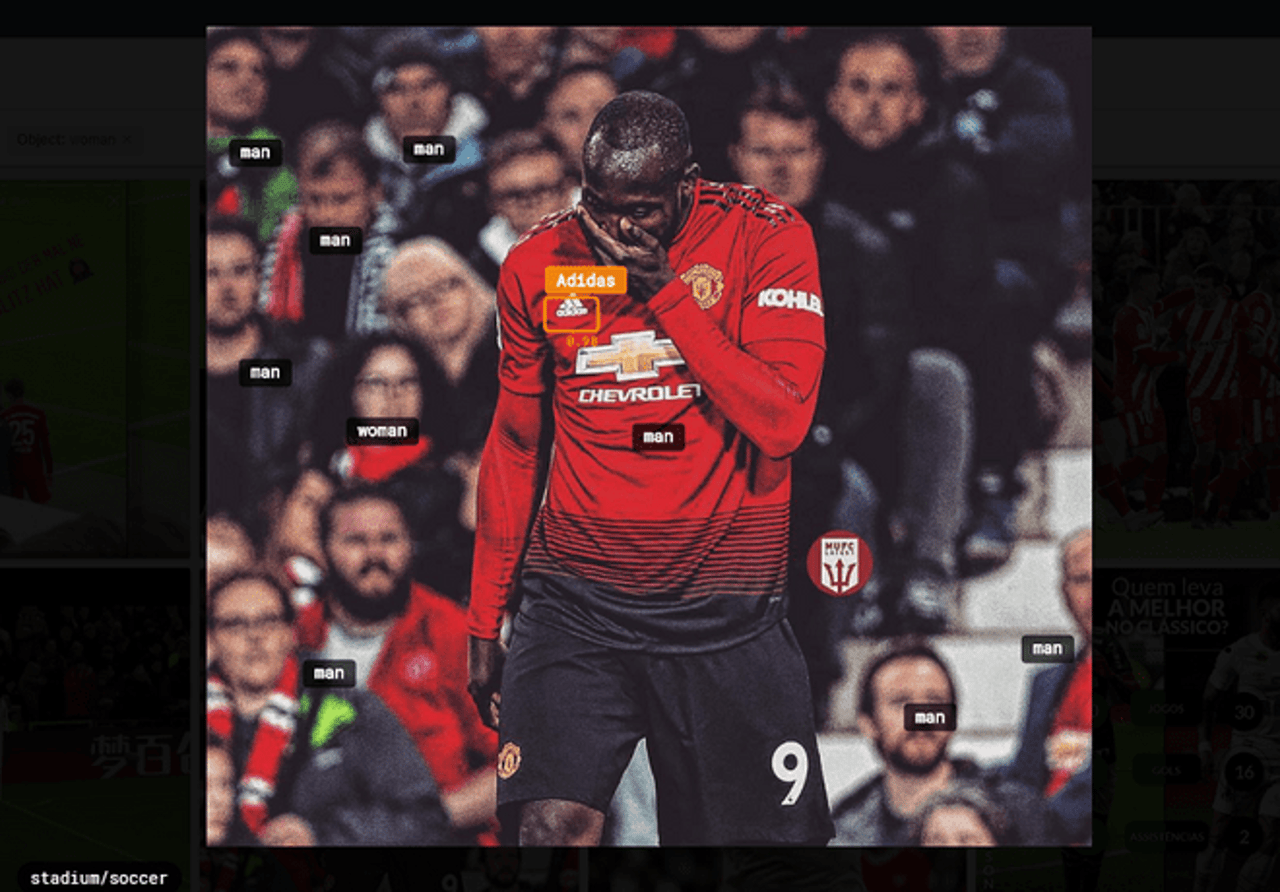
YouScan recently launched a unique function that allows users to analyze visual mentions of the brand by identifying its logo and other recognizable visual assets. This tool offers new opportunities for building a communication strategy between brands and their consumers.
We're always evolving - that's why now, the Visual Insights function can help you analyze the visual context of both the mentions that contain the brand's logo, as well as the images found through keywords used in their captions.
If this function is enabled in your account, YouScan will analyze every image in your topic streams, identify the objects depicted in these images, and recognize the setting for these images by figuring out where and under what circumstances the photo was taken.

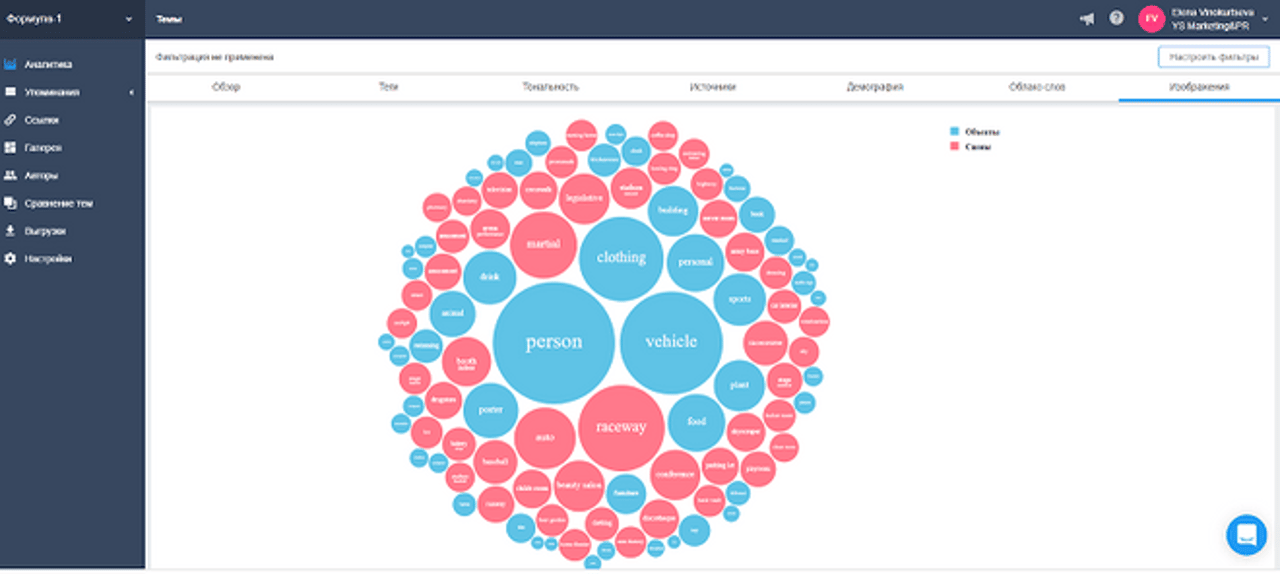
We developed a special visualization system in order to better understand which objects or places most frequently appear in any given topic stream. In this system, objects and settings are represented by bubbles of various sizes: The greater the number of mentions that contain a particular object or setting, the bigger its bubble. Objects are represented by blue bubbles, while pink bubbles depict settings.

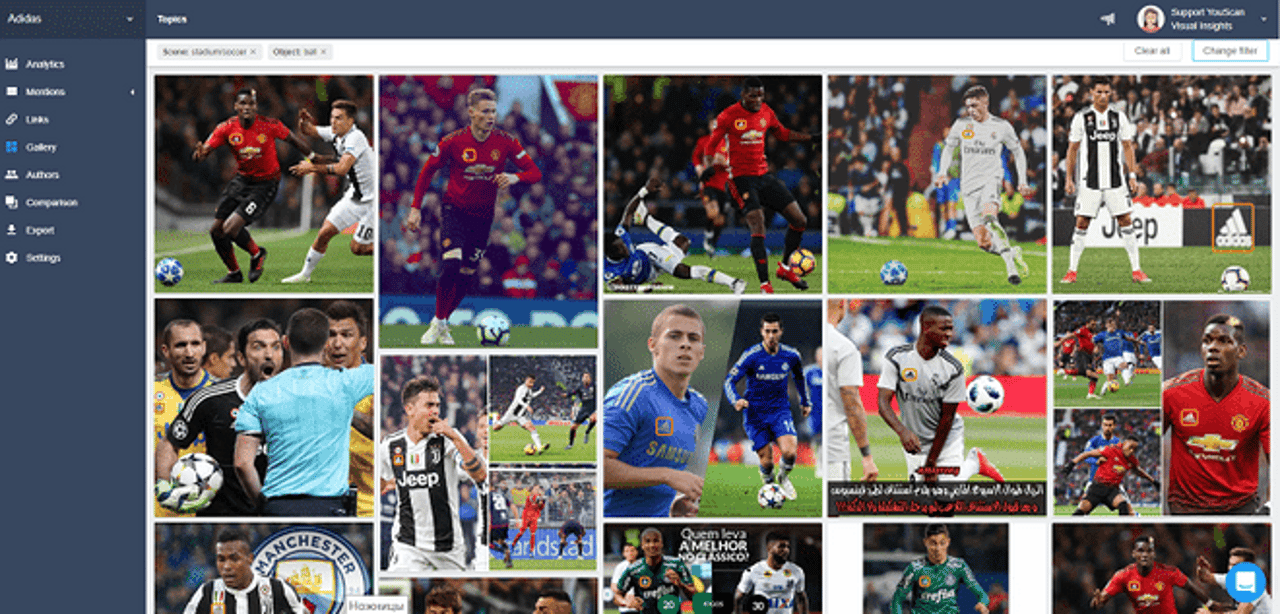
You can dive deeper into the Visual Insights of a particular object or setting by simply clicking on the corresponding bubble. This allows you to track mention dynamics, or view mentions with the highest engagement in the Gallery tab.

Be a trendsetter! Use Visual Insights to keep track of the new generation of Instagrammable spaces
Have you ever thought of tracking the context in which users are most likely to share photos of your branded assets?
Nowadays, marketers aim to leverage organic user-generated content in their visual content strategy. The goal of many contemporary events, locations and spaces is to be "Instagram-worthy" - worthy of being the visual setting of their customers' social media appearances. The future of marketing lies in creation of such Instagrammable spaces, which will set the perfect environment for a new type of customer experience with the brand.
And the good news is: You already have the perfect tool to identify and measure this kind of customer experience!
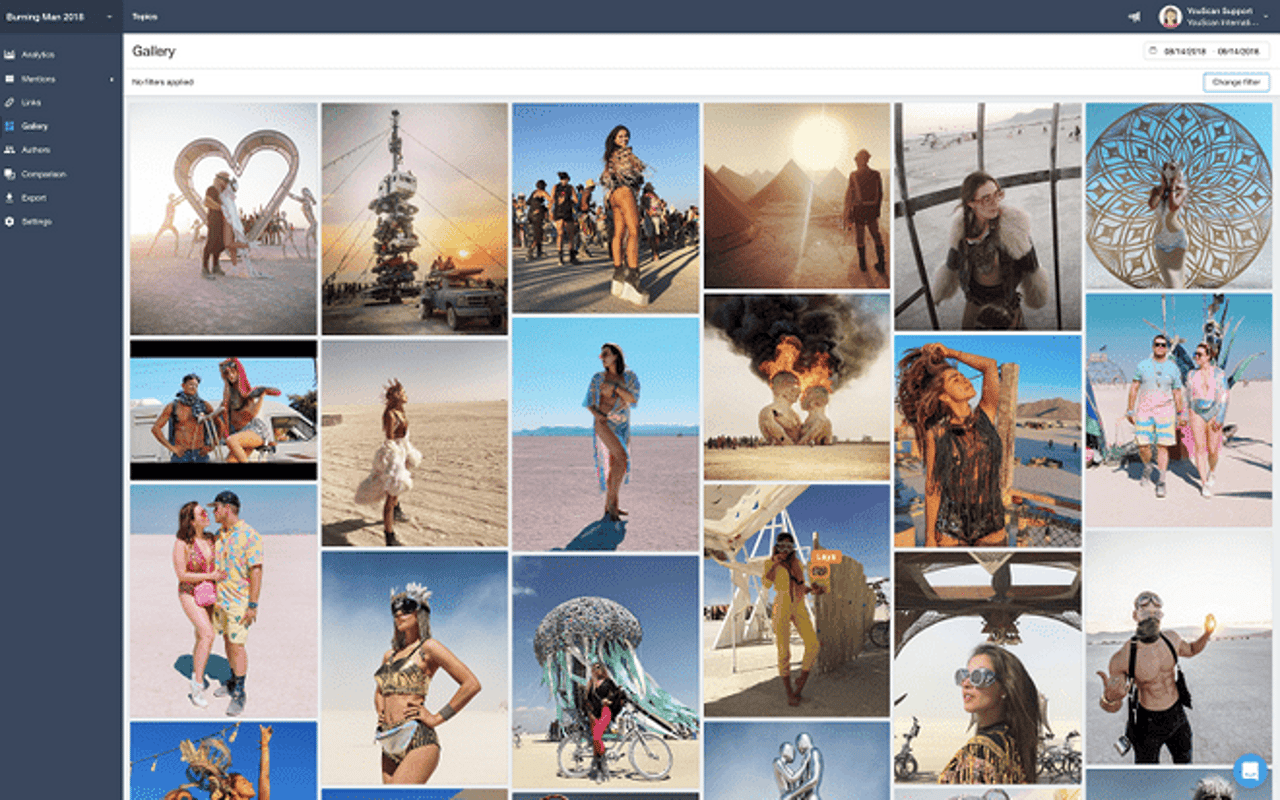

Photo gallery of Burning Man 2018 attendees. Our analysis of this festival revealed promotion strategies of brands that were supposed to be absent from the event, per its commodity-free mandate. Check out the photo in the centre of the collage.
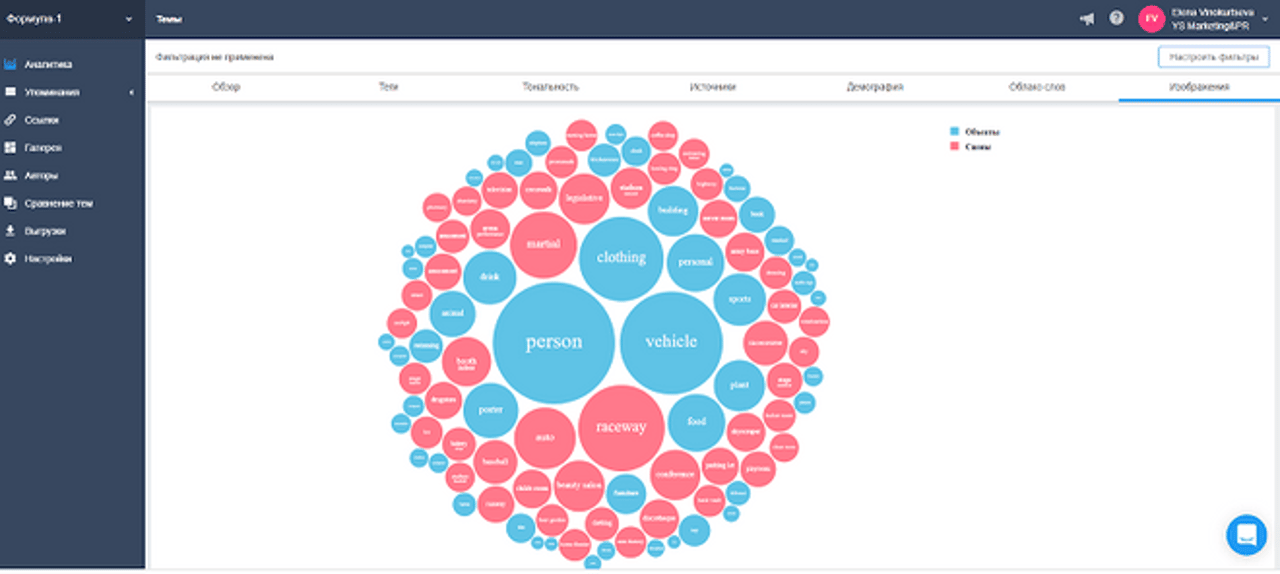

This is what a more accurate and informative analysis of the objects and settings contained in the photos above.
By clicking on one of the bubbles in this cloud of objects and settings, we get a more granular look at the context of these photos:
Top of the list for the most popular settings is the Black Rock desert landscapes.
And among the top most frequently featured objects (besides people) are motorcycles, bicycles, planes, and smartphones, selfies' eternal companions.
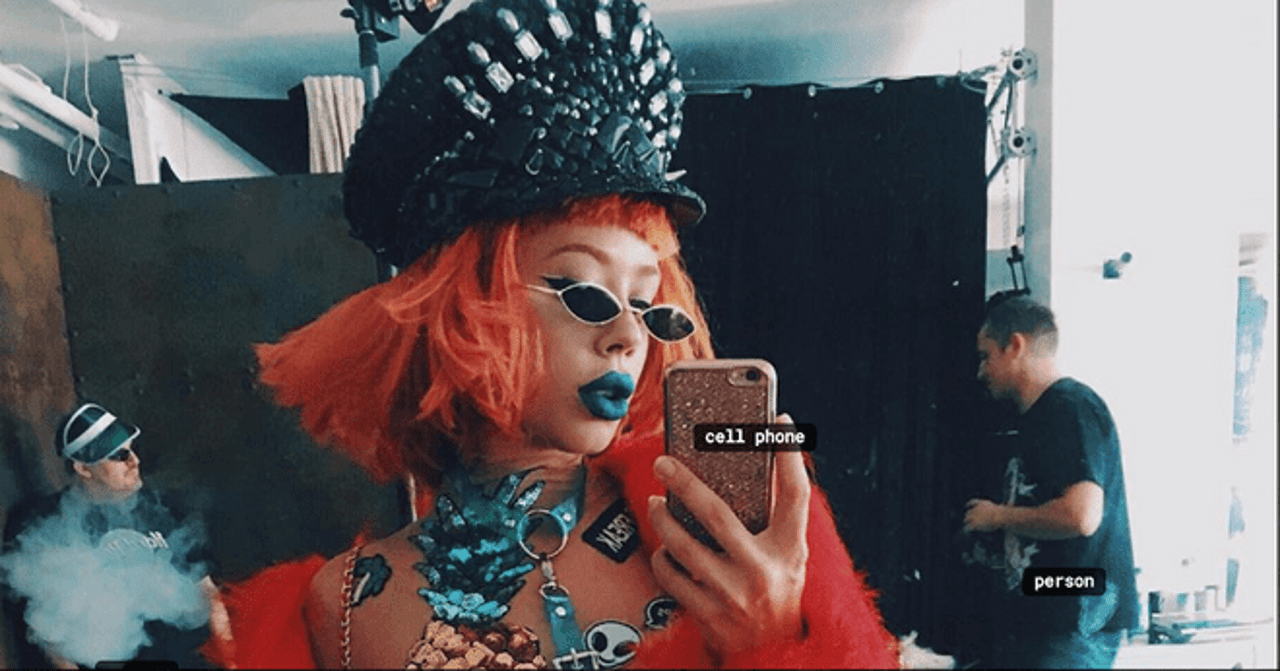

Using these tools, you can analyze any large-scale event that reaches a wide audience, such as championships, festivals, forums, conferences, fashion shows, and many more. At the very least, you will be able to analyze:
Which brands stood out at the event;
What type of audience was reached;
Which objects and settings frequently appeared in photos from this event.
And the rest will be determined by your imagination and the imaginations of your consumers!
Stay tuned for more remarkable news from YouScan! We are solidifying our position as a leader in the market for social media monitoring in the CIS, expanding our services to foreign markets – all while continuing to enhance our product for customers.


.png)