Ultimate guide on Custom Dashboards

Our team is always working on improving our system and making it as easy to use as possible. Today we are happy to release our new feature — Custom Dashboards, aiming to simplify your social media intelligence tasks.
What is a custom dashboard and how it differs from other dashboards in YouScan
The dashboard itself is not something new to YouScan — we already had powerful dashboards in our system. But now, we decided to go even further and launched an individual page where you can create your Custom Dashboards and include the data that you personally need to see in one place.
In short, the Custom Dashboard is a brief visualized report of the primary metrics you are interested in most of all.
Custom Dashboards are now available in Analyze plan and higher. The amount of dashboards available depends on your price plan, so contact your manager to find out how many you can create.


How to use Custom Dashboards
YouScan has multiple features and possibilities to visualize data, but sometimes, our users need to see the general situation without detailed analytics. Or vice versa, get an instant report on specific topics. Anyway, custom Dashboards are aiming to save time spent on routine, repeated tasks.
Below we listed the most common use cases for Custom Dashboards.
1. Key metrics regular monitoring. Most of our clients need to track specific data regularly. Usually, this might be done in Analytics, which has more advanced features such as applying multiple filters, rules, or even manual segmentation. However, these settings should be tuned from time to time, and all the data might be split within multiple tabs. On the other hand, Custom dashboards are designed to get instant access to the data segments that require regular monitoring in one place.
2. Comprehensive reporting. Executives or other stakeholders can see the whole picture in one place without setting any filters manually. You can gather key metrics that are usually situated in different tabs within our system on a single dashboard. Anytime you open the dashboard, the widget layout and filters remain the same, and you can always see the current metrics. Also, the dashboard can be shared via a link, allowing non-YouScan users to access it.
3. Simple campaign analysis. If you have several running campaigns, it might be tricky to track their performance simultaneously. Now, you can create a separate dashboard for each of them. Or vice versa, place widgets with the same metrics next to each other to analyze which campaign brings better results. Another use case is placing widgets of "before the campaign", "during the campaign", and "after the campaign" on the same dashboard.
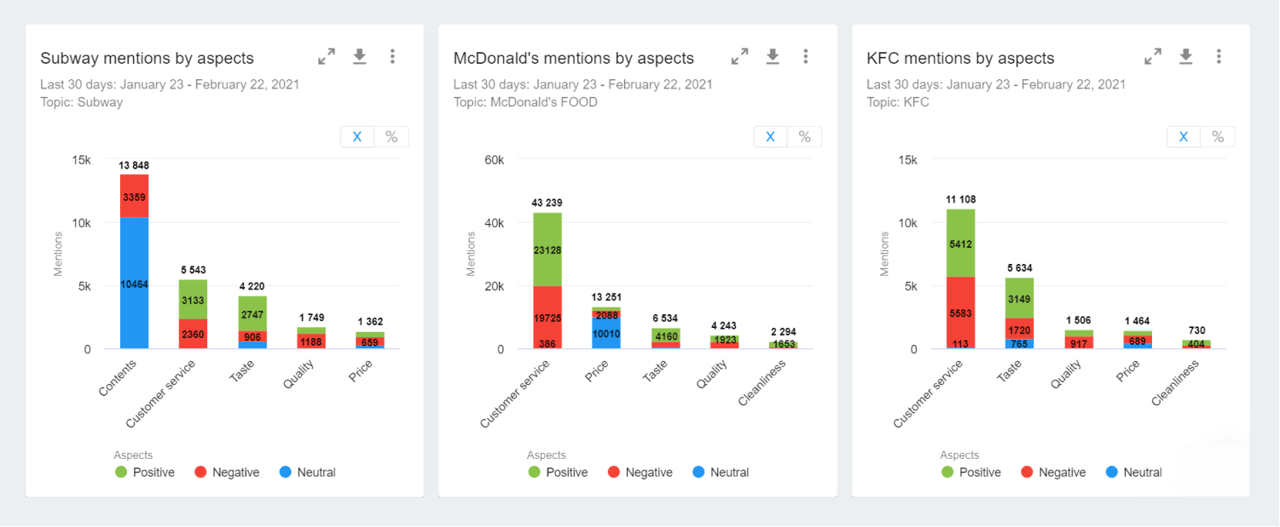
4. Easy competitor's analysis. Since you can create widgets containing data from different topics, you can use that to craft an easy-to-use visualization to analyze your competitor's performance. Now you don't need to switch between different topics, instead place several widgets near and see the difference between your brands on one screen.


What is a widget and how to work with it
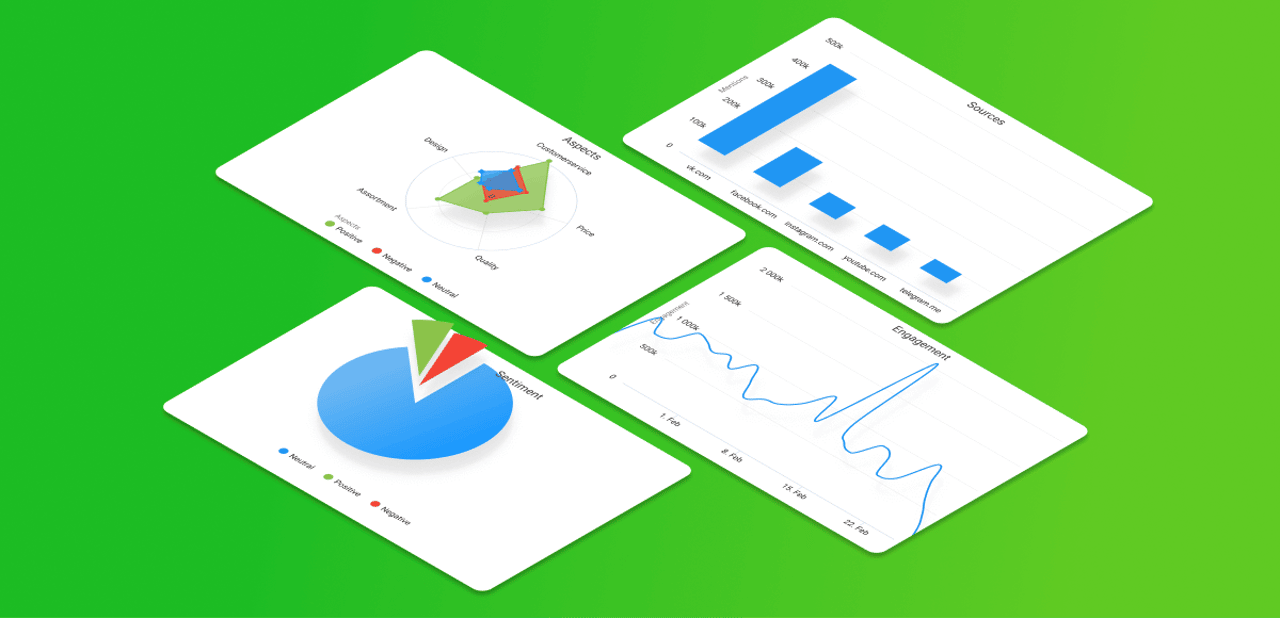
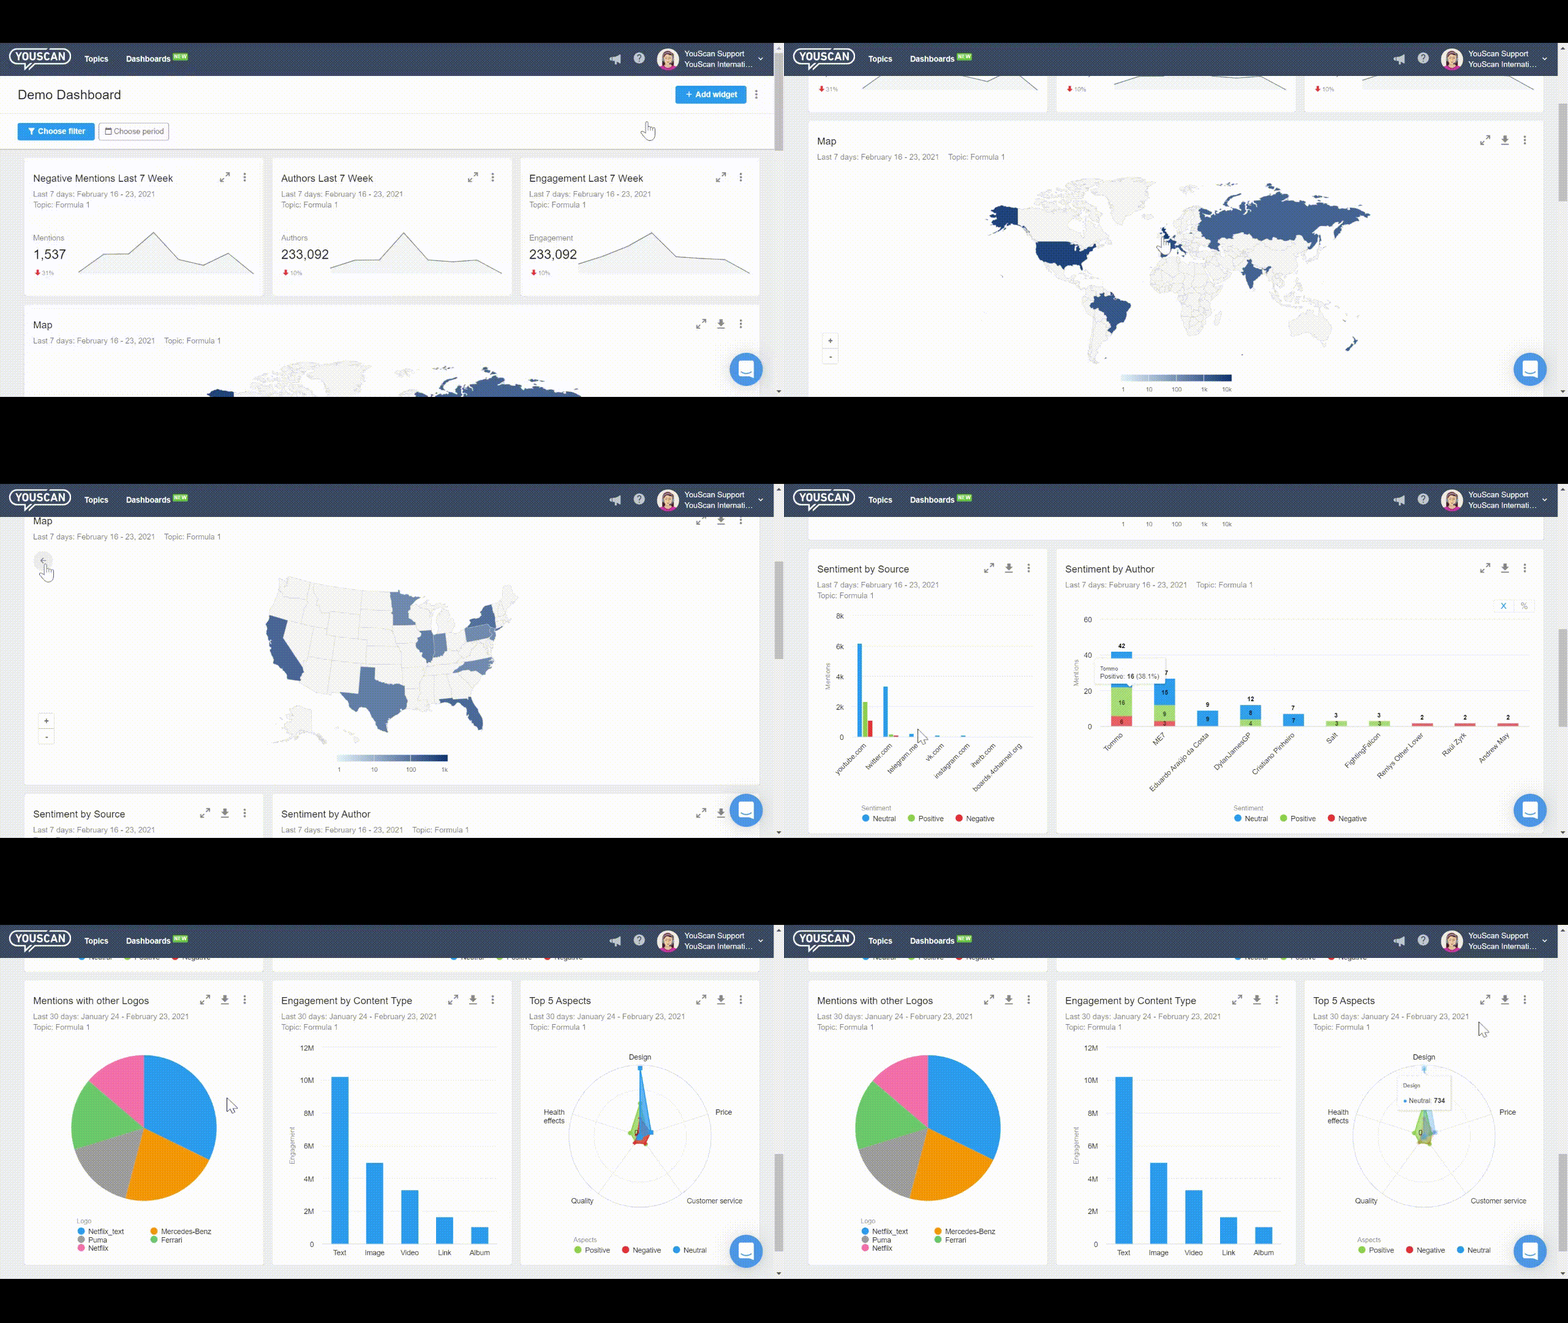
The dashboard consists of widgets — different data visualization forms (chart, map, diagram, etc.). You can fill the dashboard with a maximum of 15 widgets. We added this limit to ensure that the dashboards you create will be informative enough but not overwhelming.
One dashboard may contain widgets from different Topics. For instance, you can compare the same metrics of your brand and your competitor.
Once you have set up the widgets and applied filters, these settings are automatically saved within a dashboard. So when you return to the dashboard, you don't have to tune it once again.
By default, the data is displayed for the last 30 days, but you can always choose any other analysis period both on the dashboard or the widget level.
As mentioned before, widgets can illustrate different types of data depending on your needs.
Here is a list of available visualizations at this moment:
Metric or Counter Widget
Line Chart
Pie Chart
Bar Chart
Spider Chart
Stacked Bar Chart
Map
We say "at this moment" as we are going to extend functionality and develop even more widgets over time.
Almost all widgets are available for exporting in such formats as PNG, JPEG, XLS, CSV, SVG, PDF.
What is unusual is that all widgets are interactive. You can click on data that is illustrated on a widget and dive directly into the mention stream. This is extremely useful if there are significant changes in some of the metrics and you want to find the reason for this activity. For example, there was a peak in negative mentions, you can click on a widget to be automatically redirected to the according tab within the system and get an immediate understanding of the situation.


How to create dashboards and widgets
The process of crafting a dashboard and setting up widgets is rather simple. You can find the detailed instruction in the dedicated article.
Bottom line
If you are reading this text, our new Custom Dashboards must have impressed you. If so, don't hesitate to request our free demo to learn more about YouScan and how it can boost your business.


![What Is PR in Social Media? Complete Rundown [2026]](https://cdn-legacy.youscan.io/cdn-cgi/image/metadata=copyright,format=auto,fit=contain,quality=70,width=1280/what-is-pr-in-social-media_.png)
